Visualization Evaluation and Meta Analysis
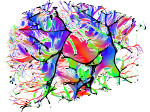
Graphs and Networks
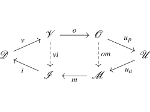
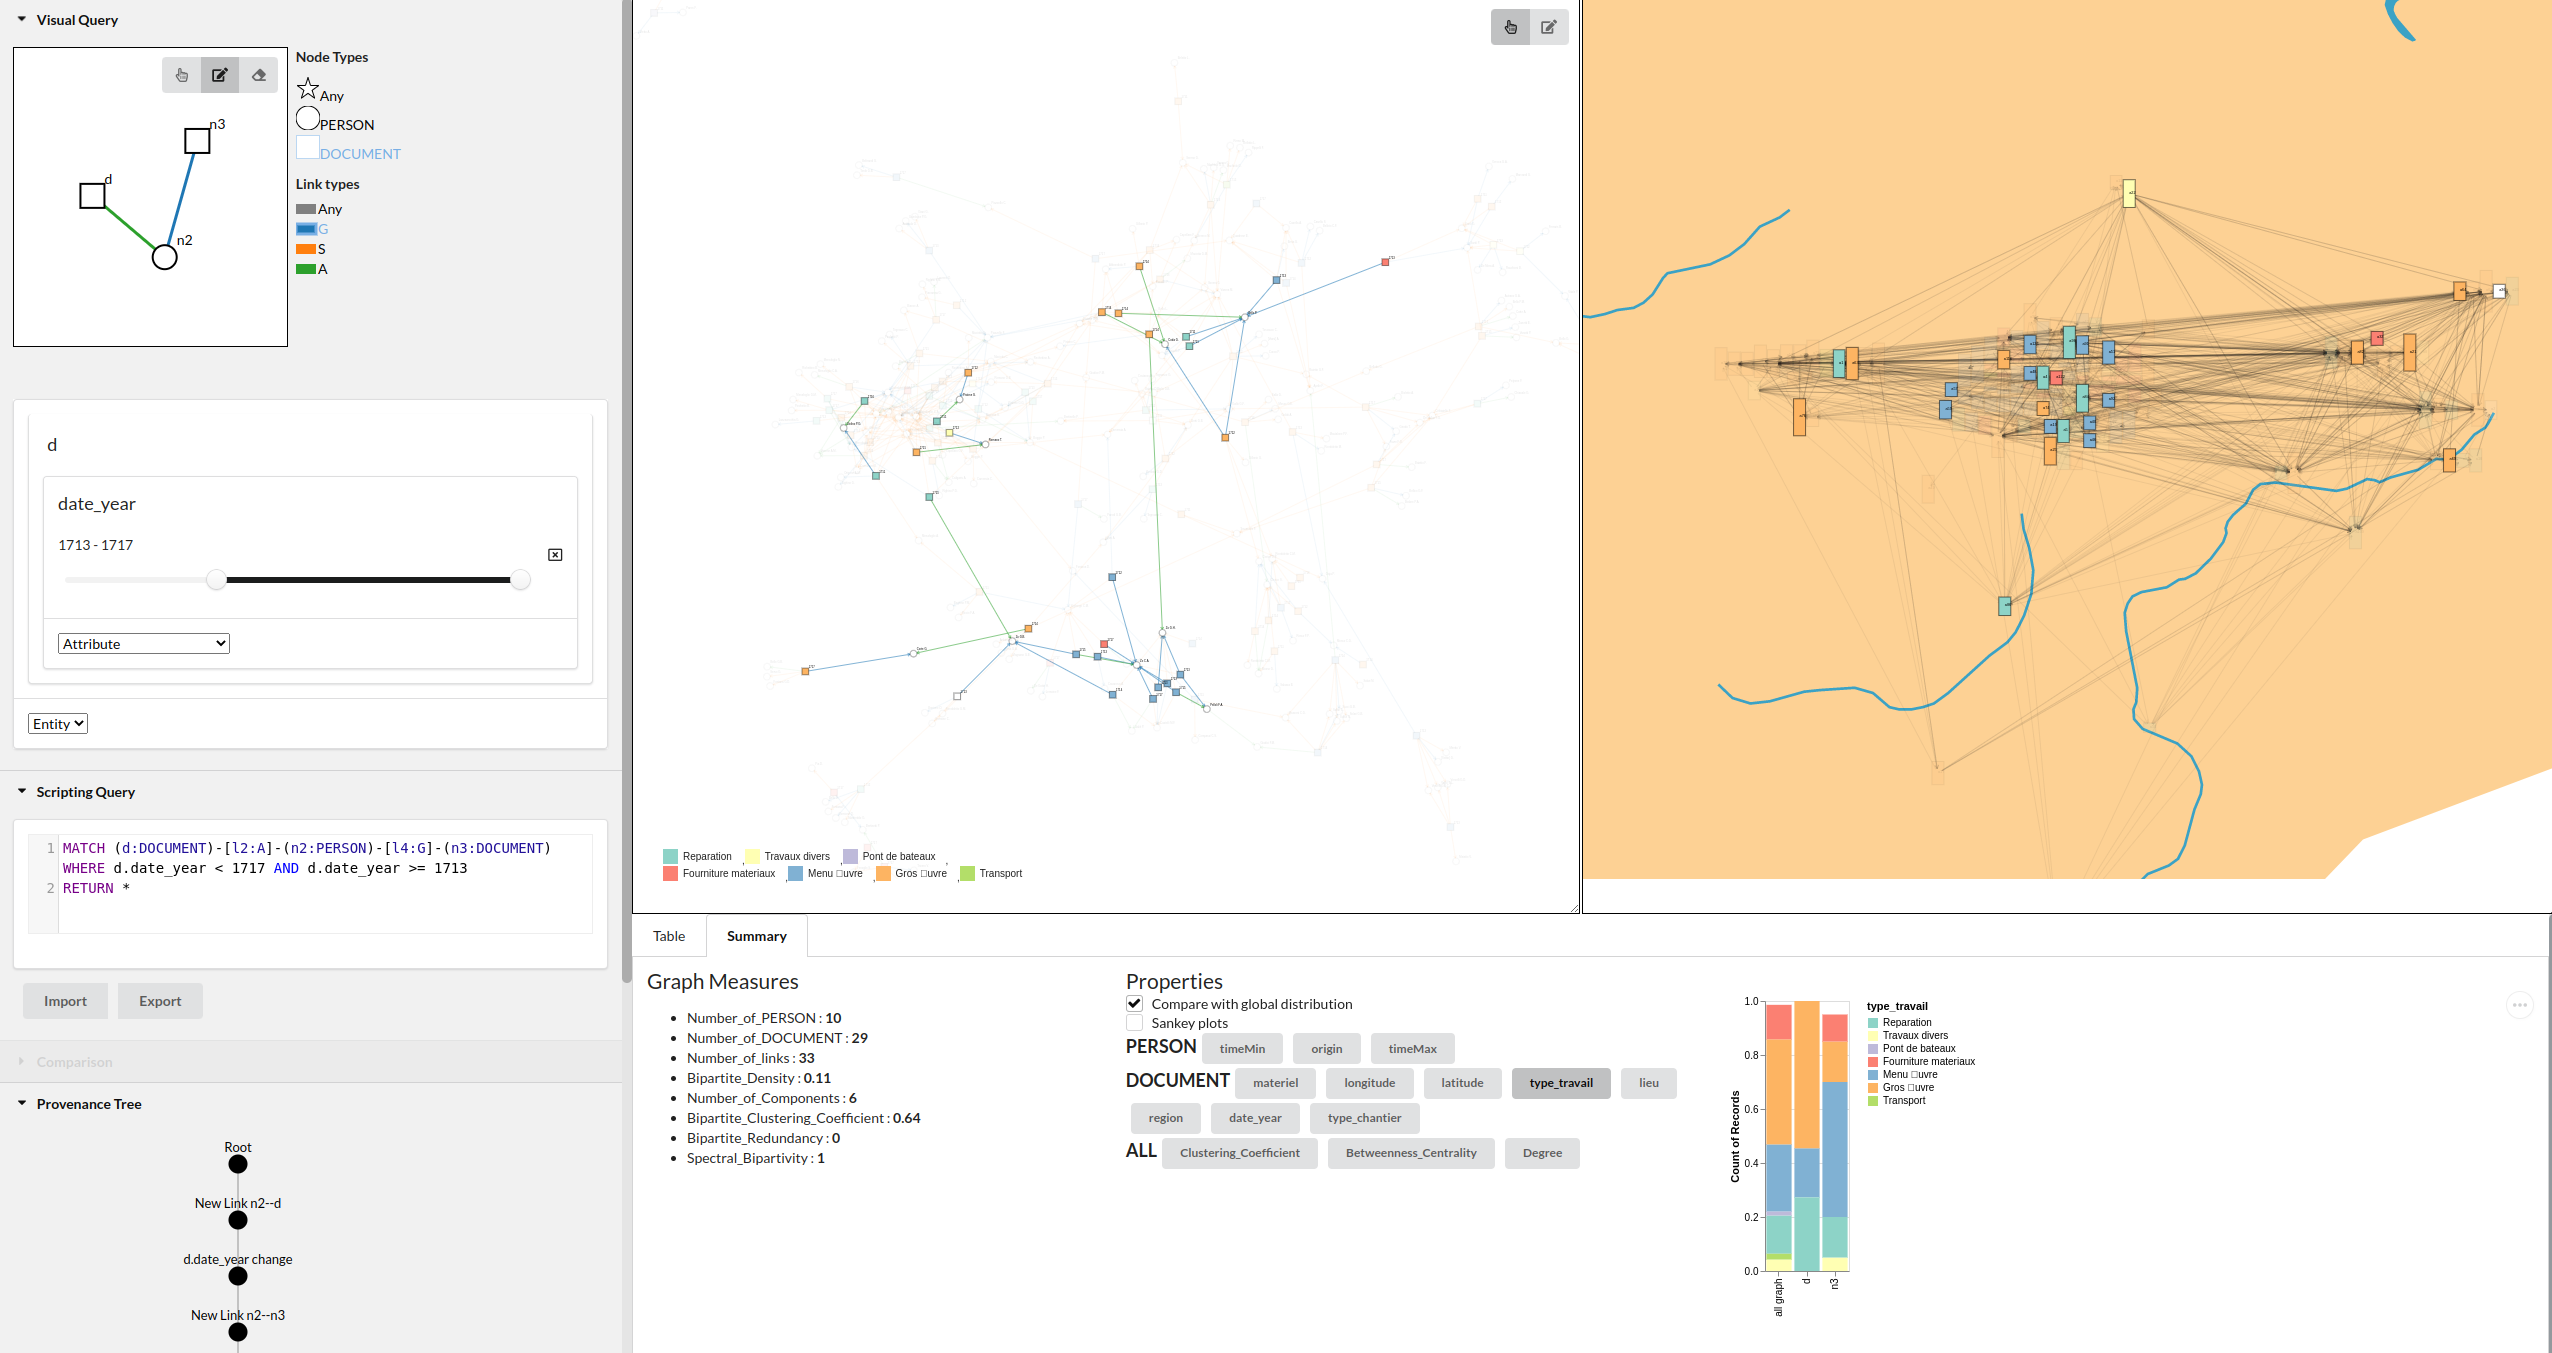 CombiNet: Query and Comparison of Bipartite Multivariate Dynamic Social Networks |
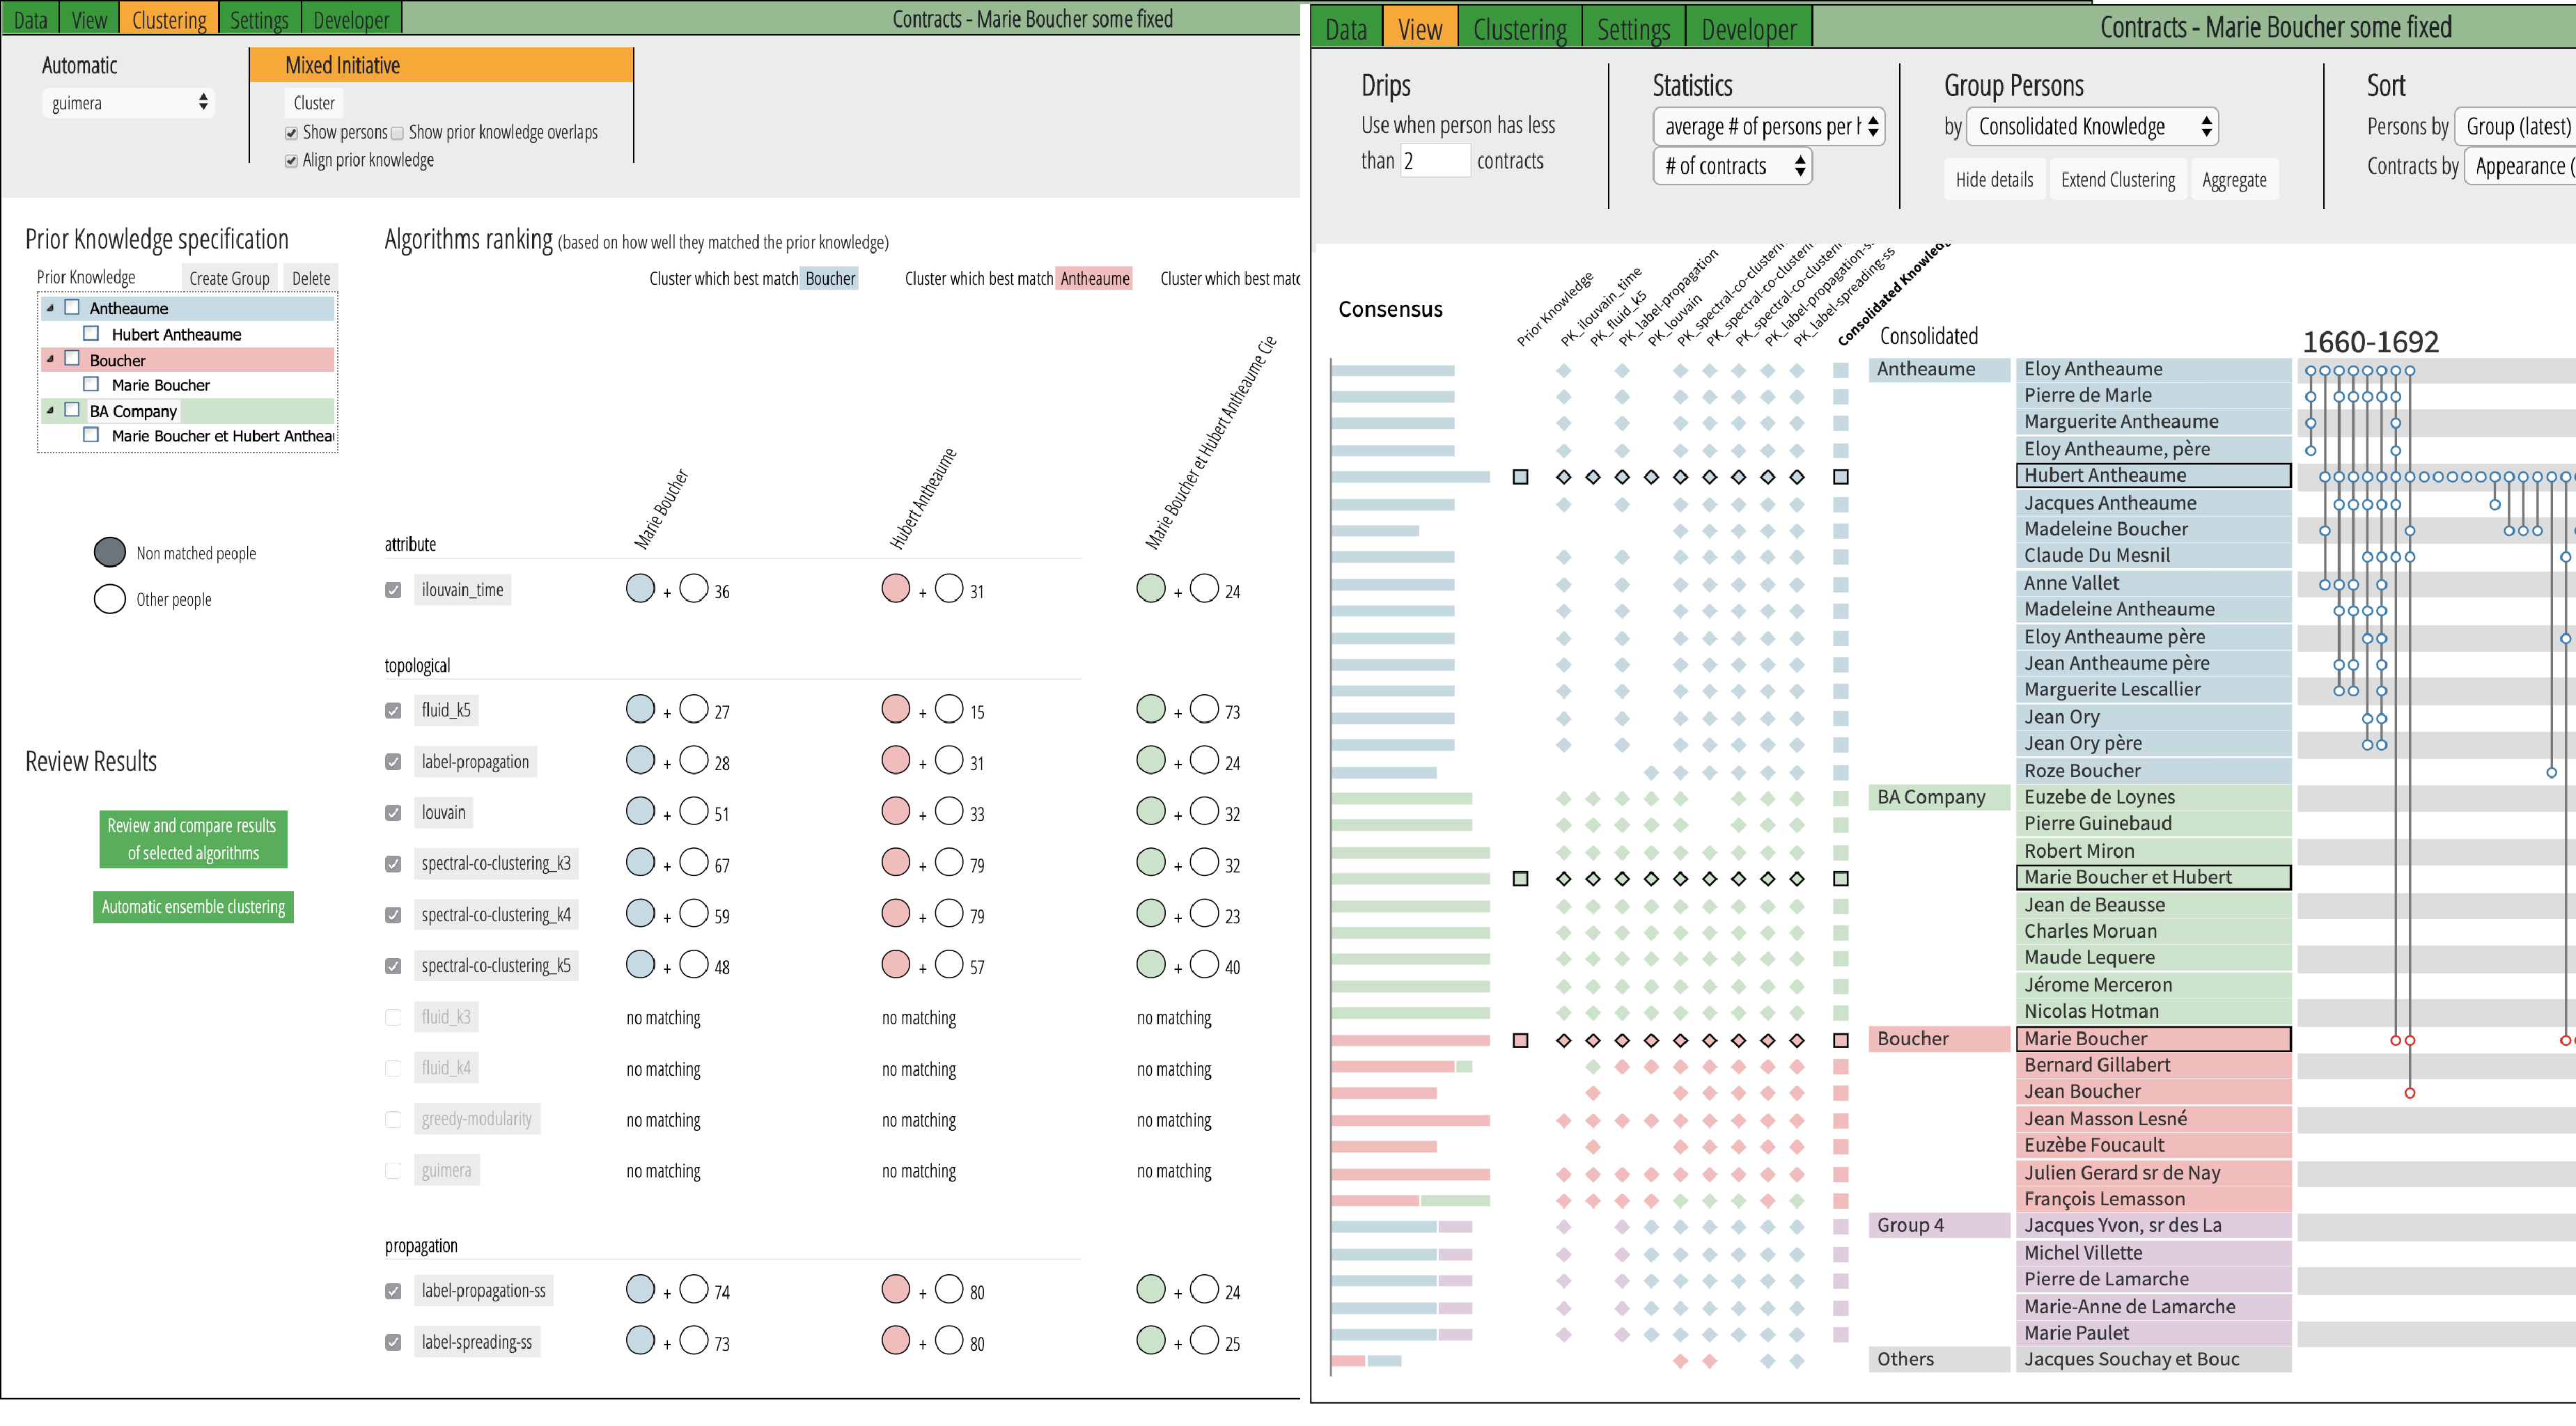 PK-Clustering: Integrating Prior Knowledge in Mixed Initiative Social Network Clustering |
 PAOHvis: Analyzing Dynamic Hypergraphs |
 The Vistorian: Interactive Visualizations for Dynamic and Multivariate Networks |
 Small MultiPiles: Piling Time to Explore Temporal Patterns in Dynamic Networks (available online) |
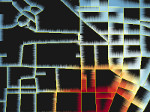
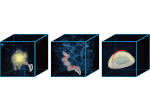
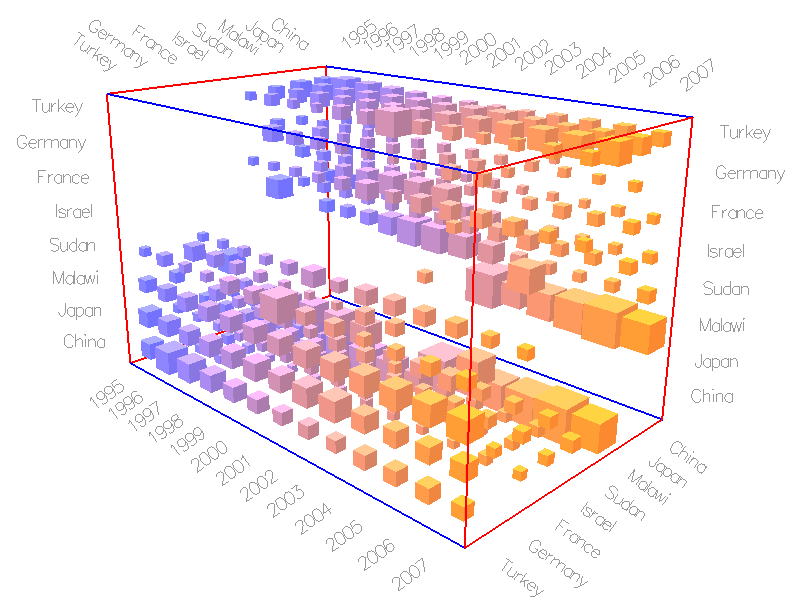 Cubix: Exploration of Dense Dynamic Networks |
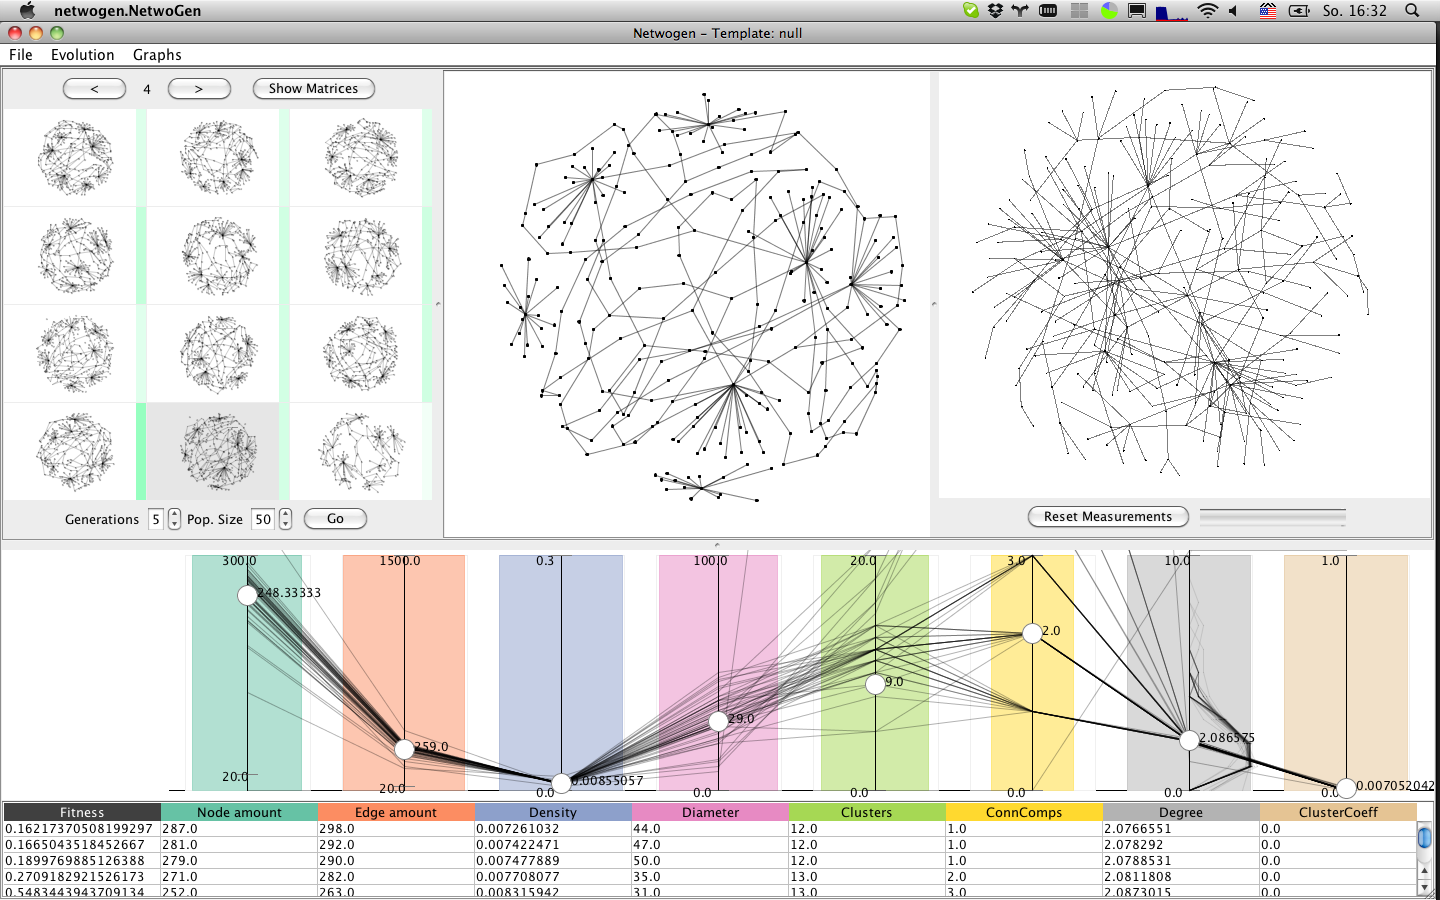 GraphCuisine: Random Graph Generator driven by an Interactive Genetic Algorithm | |
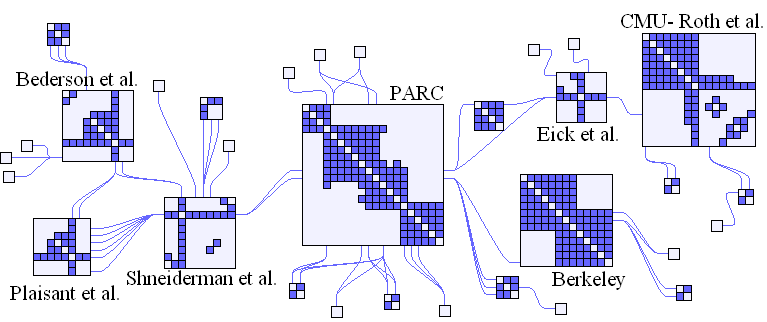 NodeTrix: Node-Link Diagram hybrid with Adjacency Matrix. |
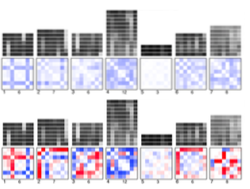
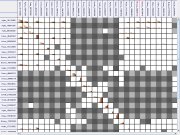 Zame: Zoomable Adjacency Matrix Explorer |
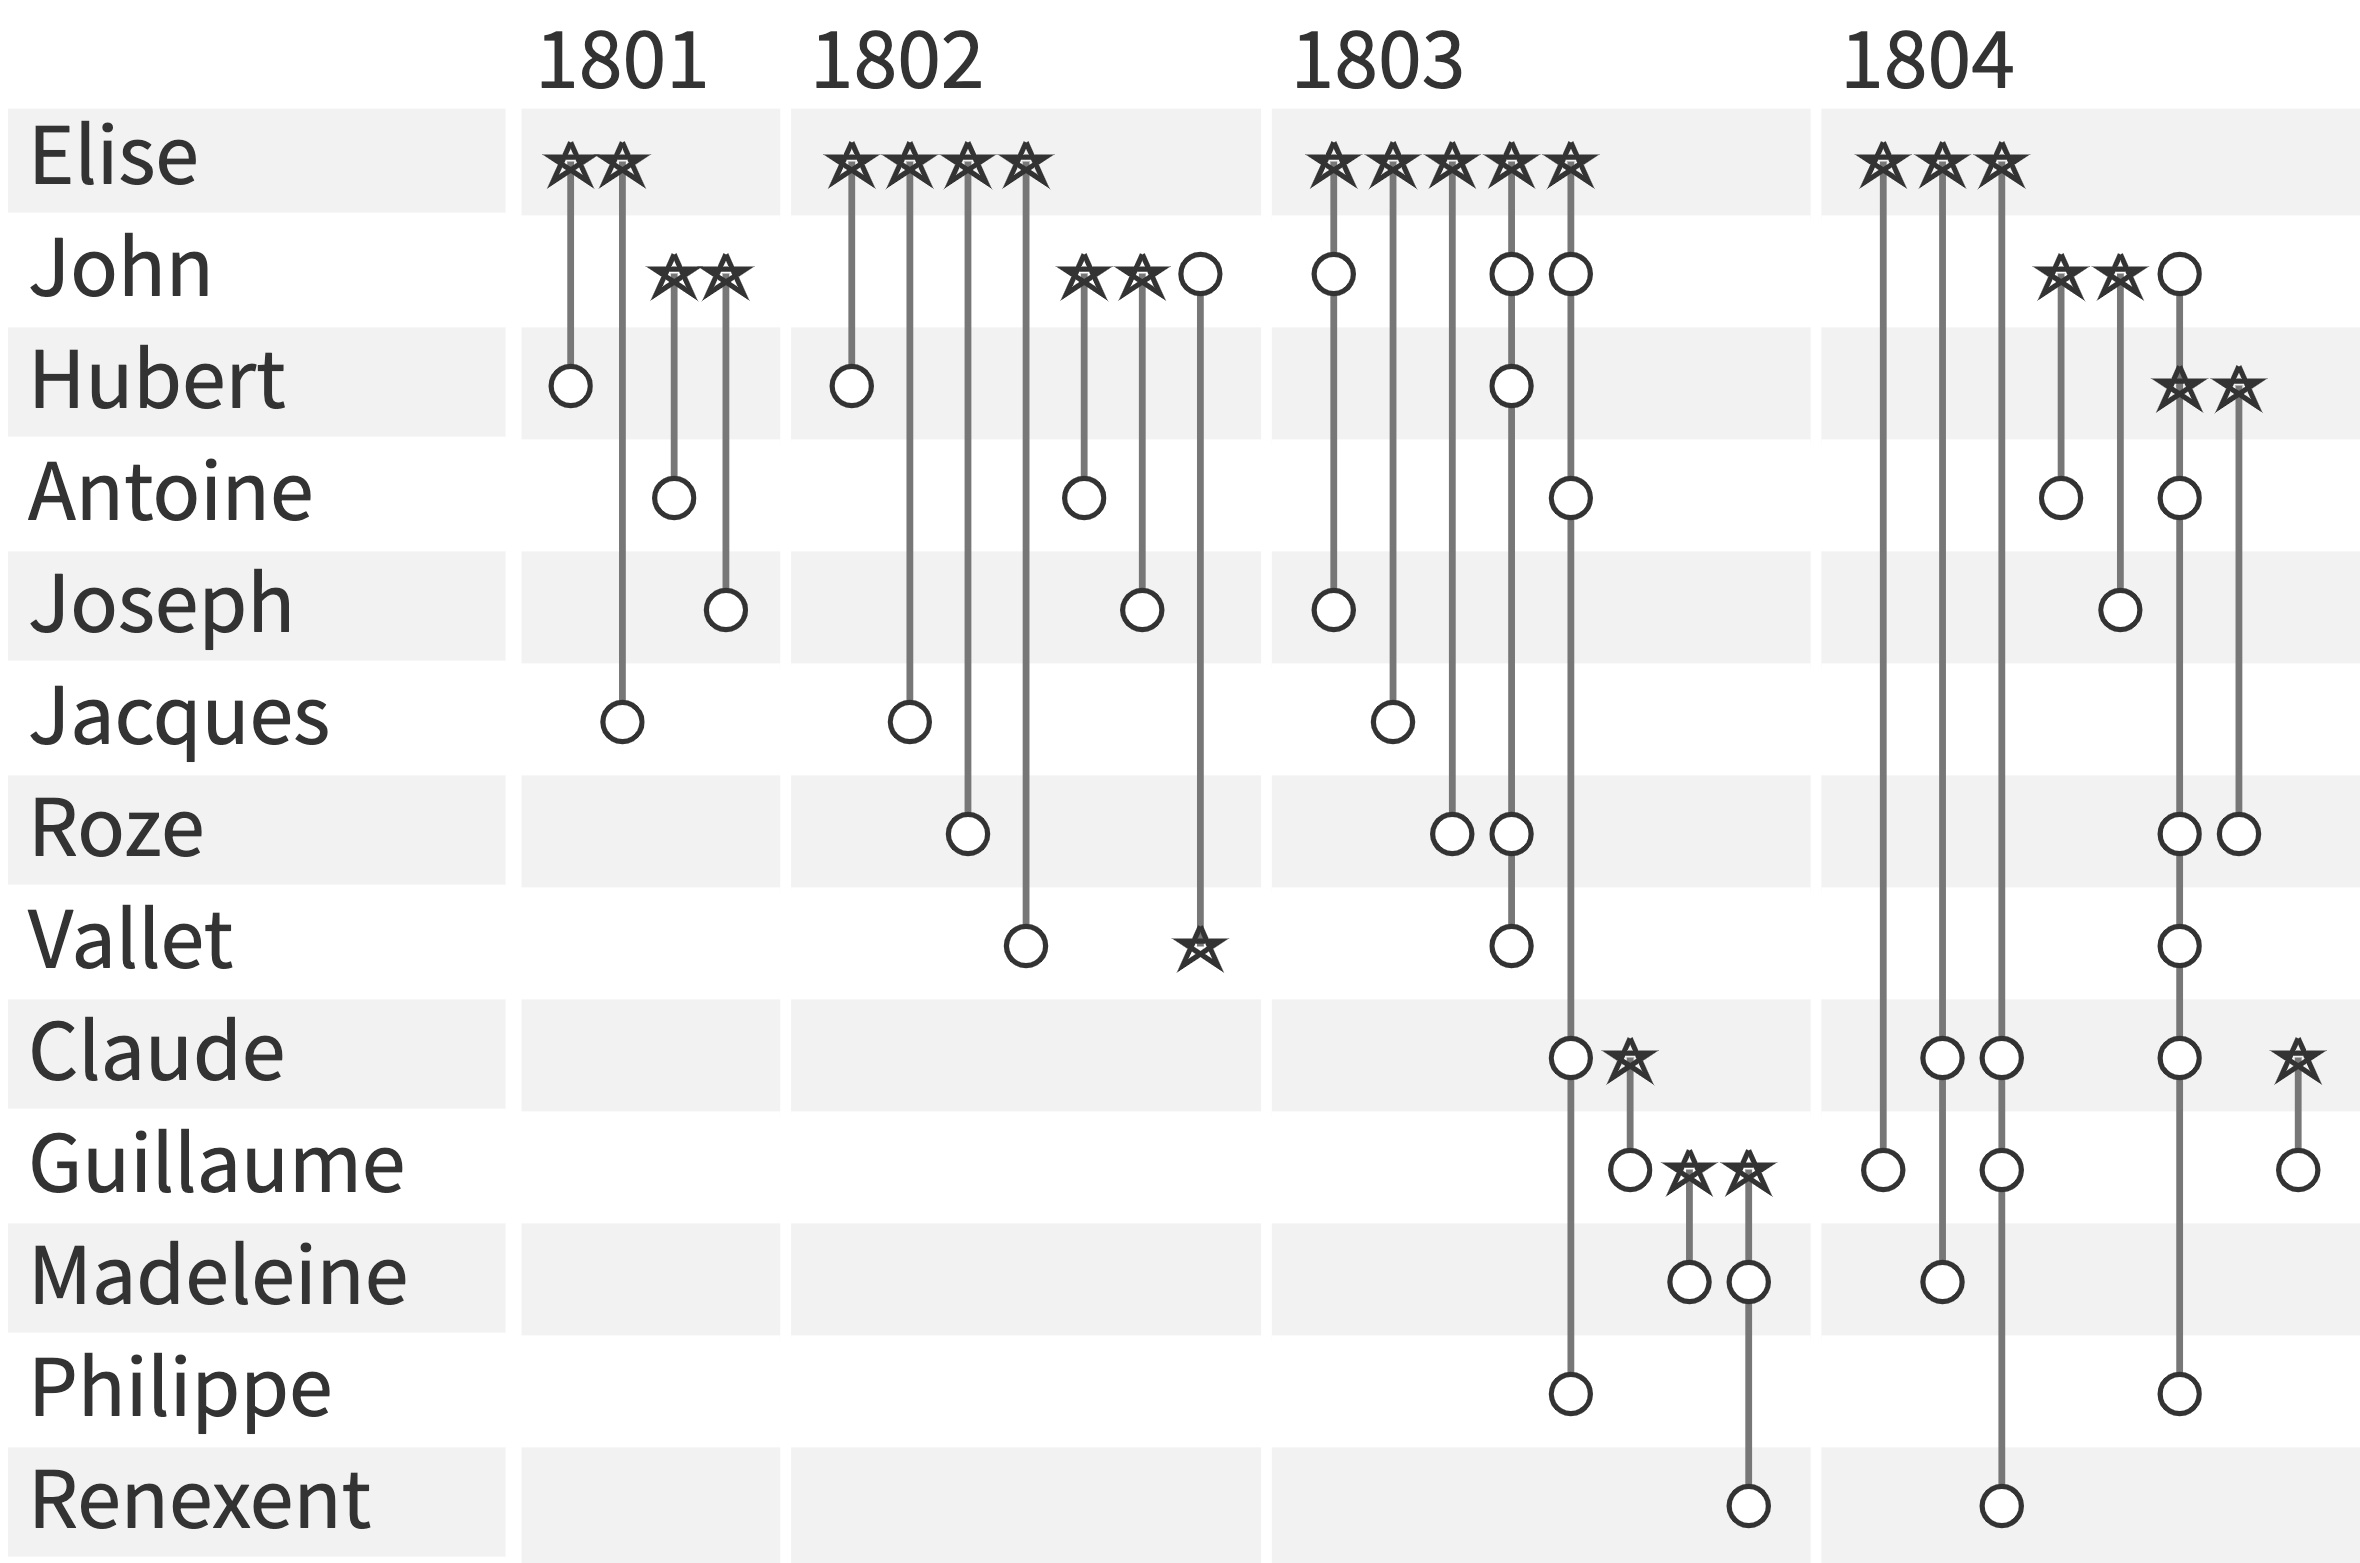
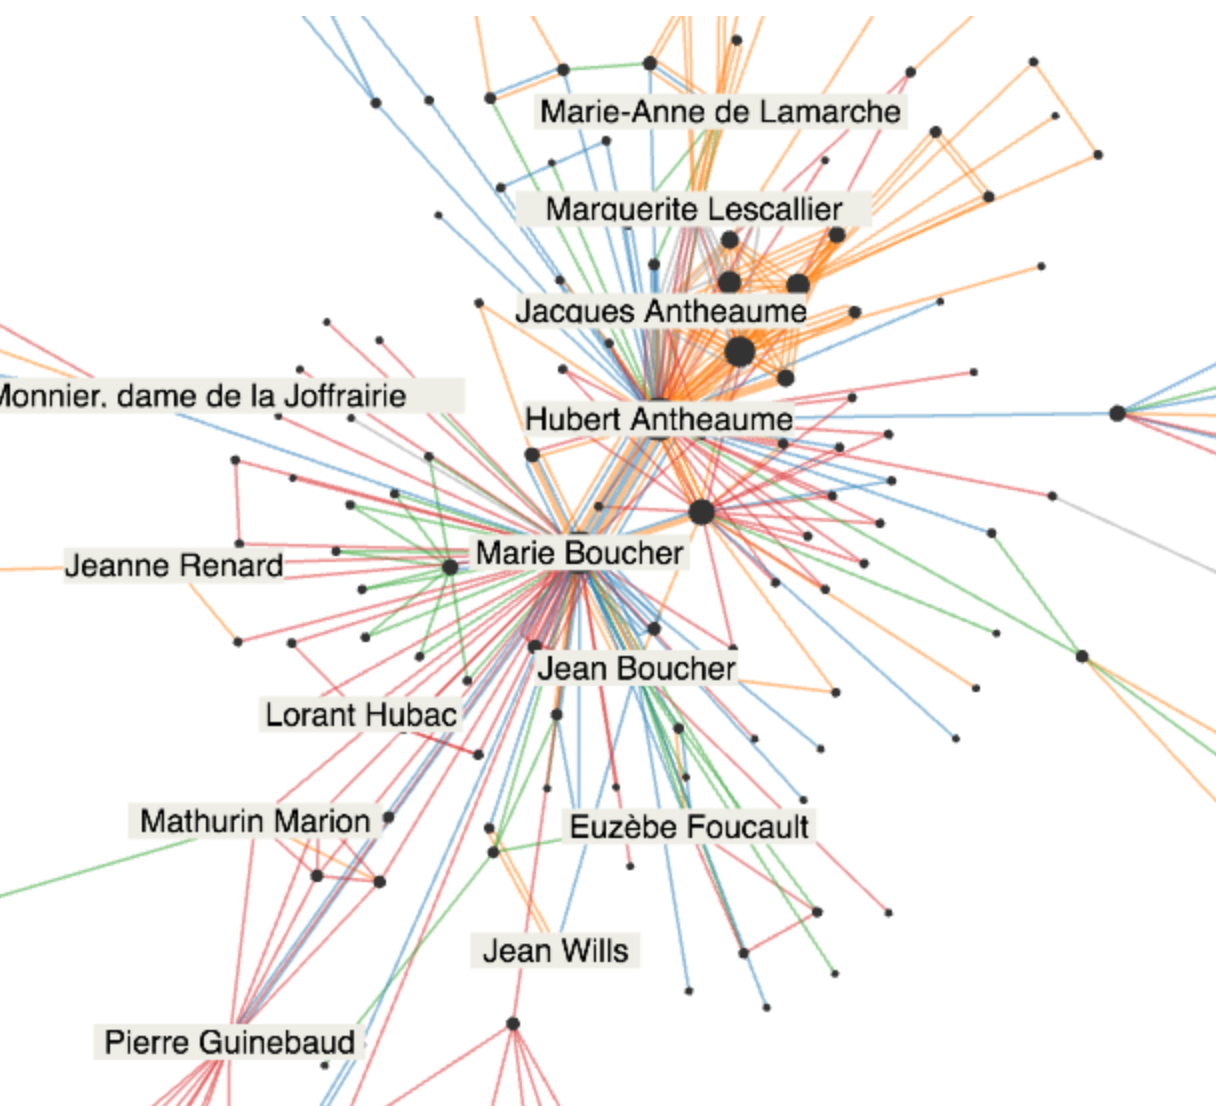
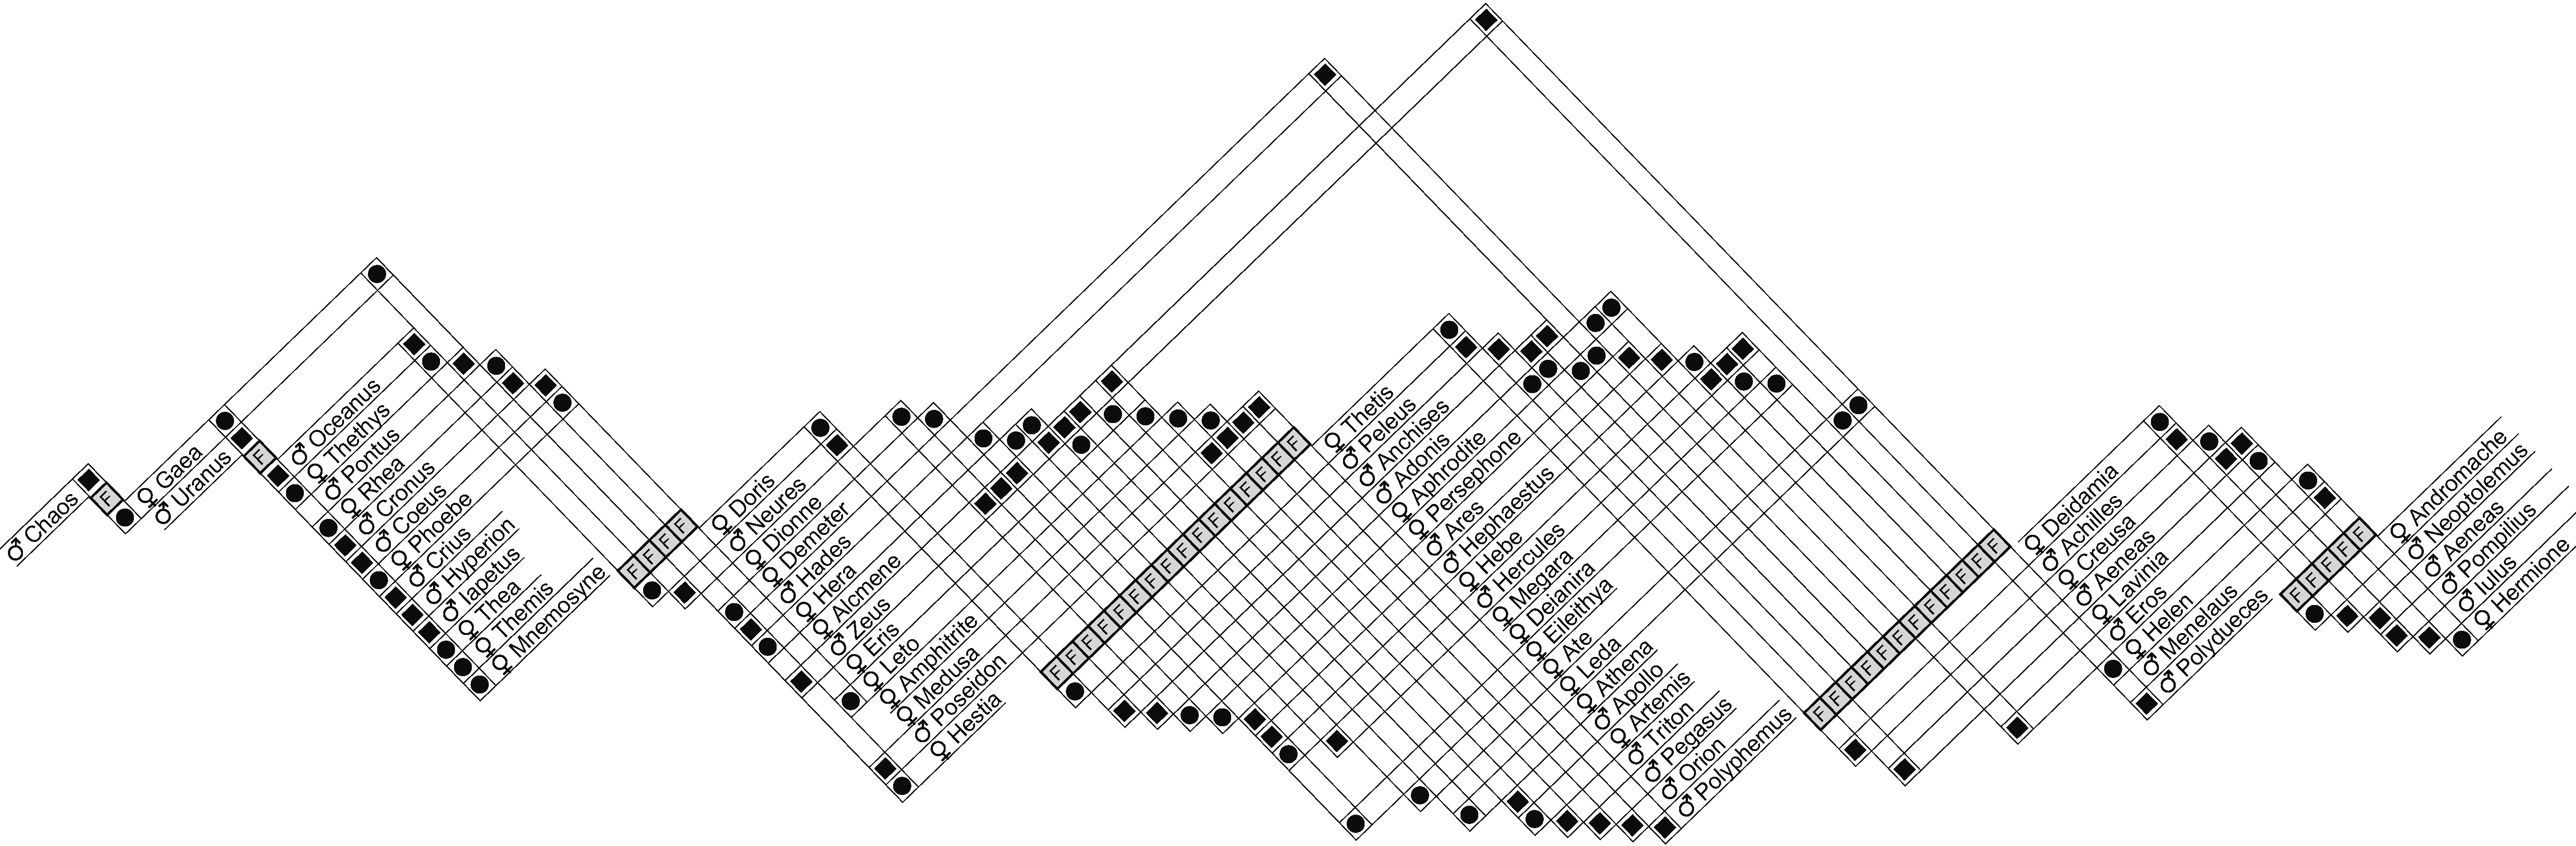 GeneaQuilts: Genealogy visualization | |
 |
 |
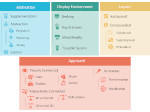
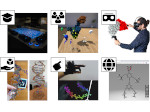
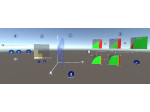
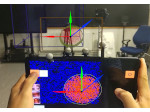
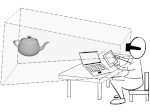
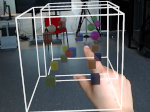
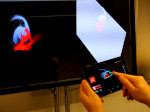
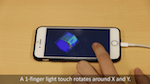
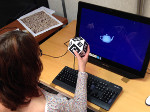
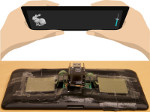
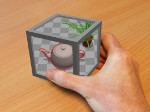
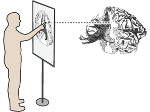
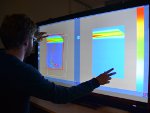
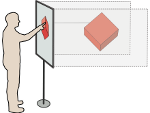
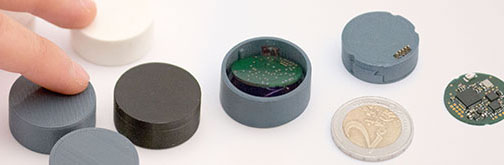
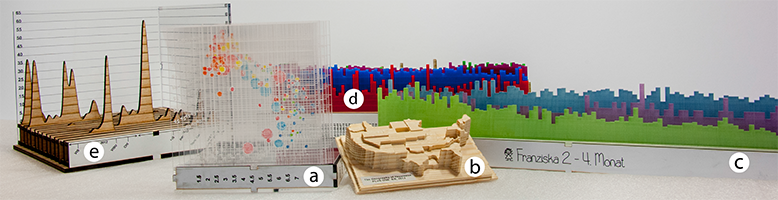
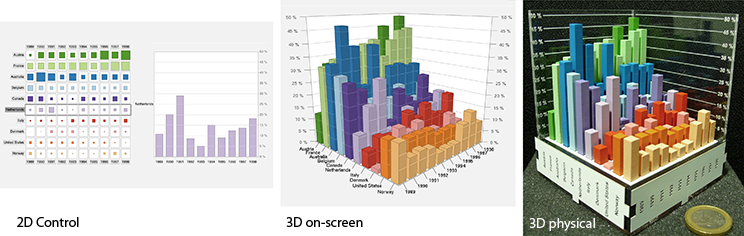
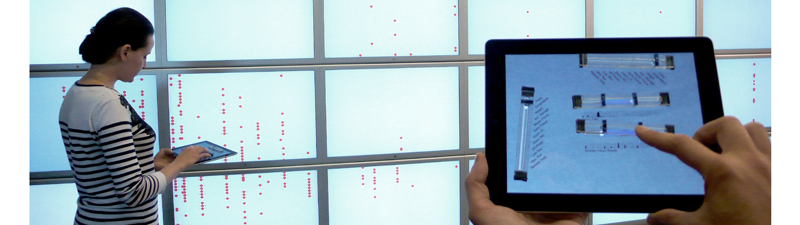
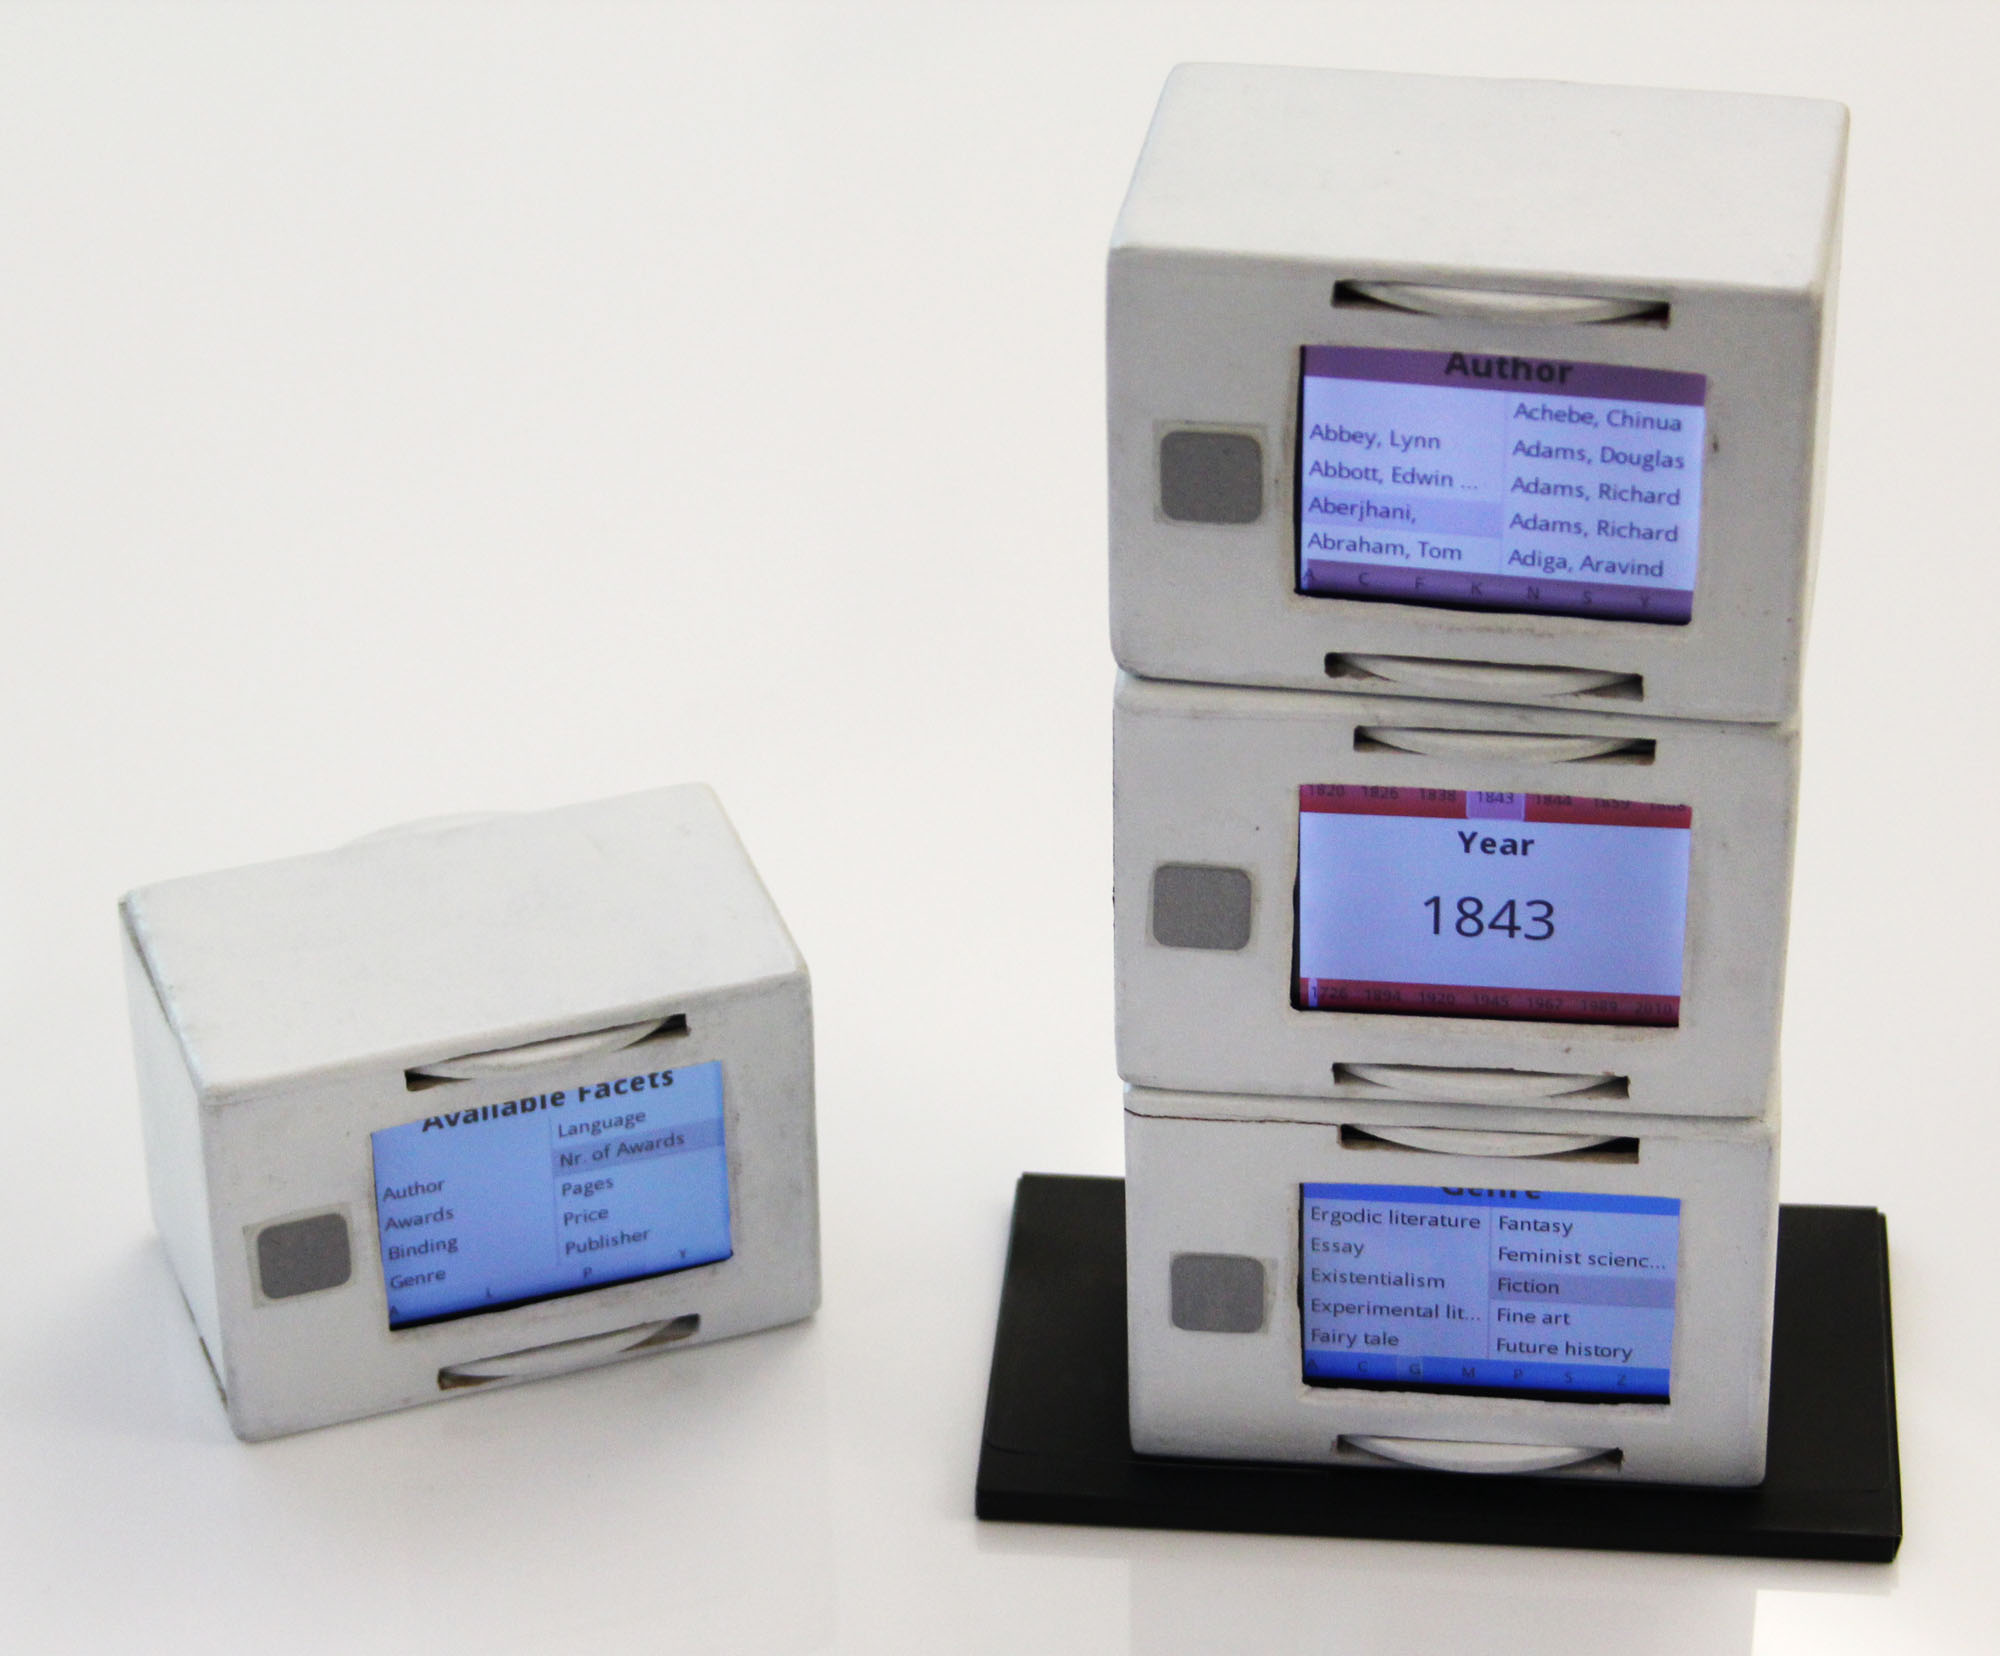
Physical and Tangible

Animation and Motion
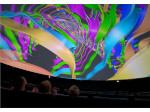
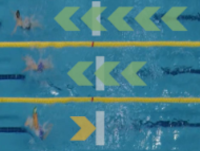 SwimFlow Situated Visualization for Swimming Videos. |
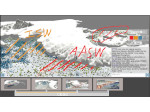
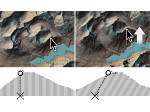
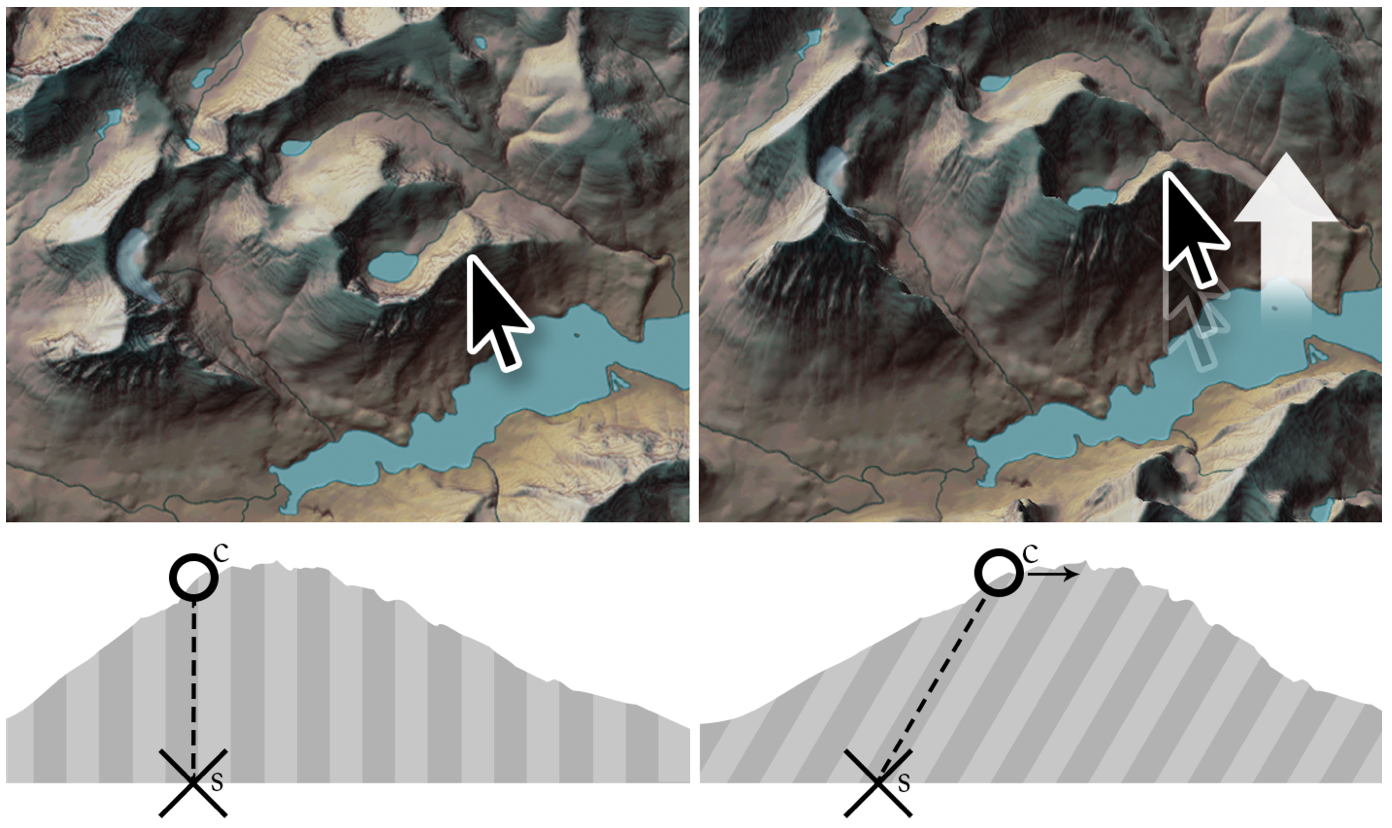 Relief Shearing for Enhanced Terrain Perception on Interactive Maps. |
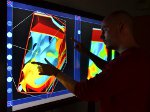
 VisualSedimentation: A visualization metaphor for data stream visualization in real time. |
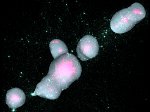
 Bubble-t: A real time visualization of Twitter streams during the 2012 French presidential election. |
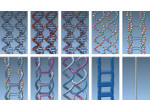
 Diffamation: Animating diffs |
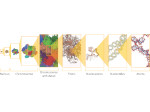
 Gliimpse: Animating markup languages |
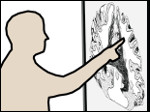
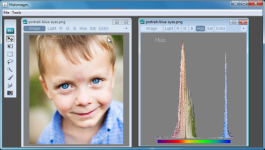 Histomages: Manipulate histograms like images |
Application Areas
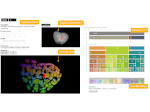
 LineageD: An Interactive Visual System for Plant Cell Lineage Assignments based on Correctable Machine Learning |
 |
 Bubble-tv: A social tv device: Bubble tv is a live visualization of TV viewers' tweets to process a poll. |
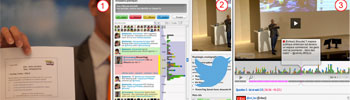 PolemicTweet: A video annotation and analysis system for live events such as conferences. |
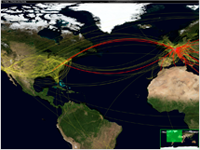
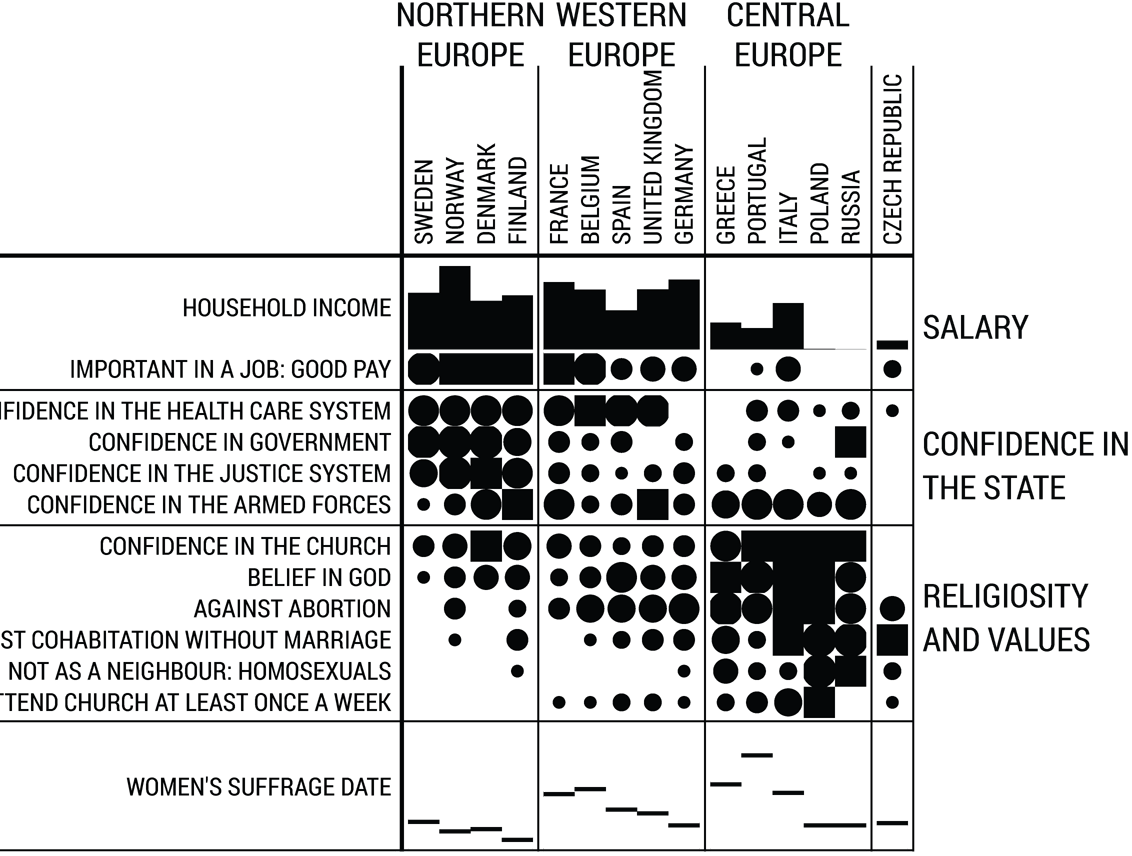
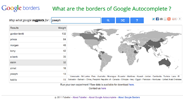 Google borders: a worldwide cultural trends analysis based on Google auto-complete suggestions. |
 |
 |
 Taranis: A training system for crisis managers. |
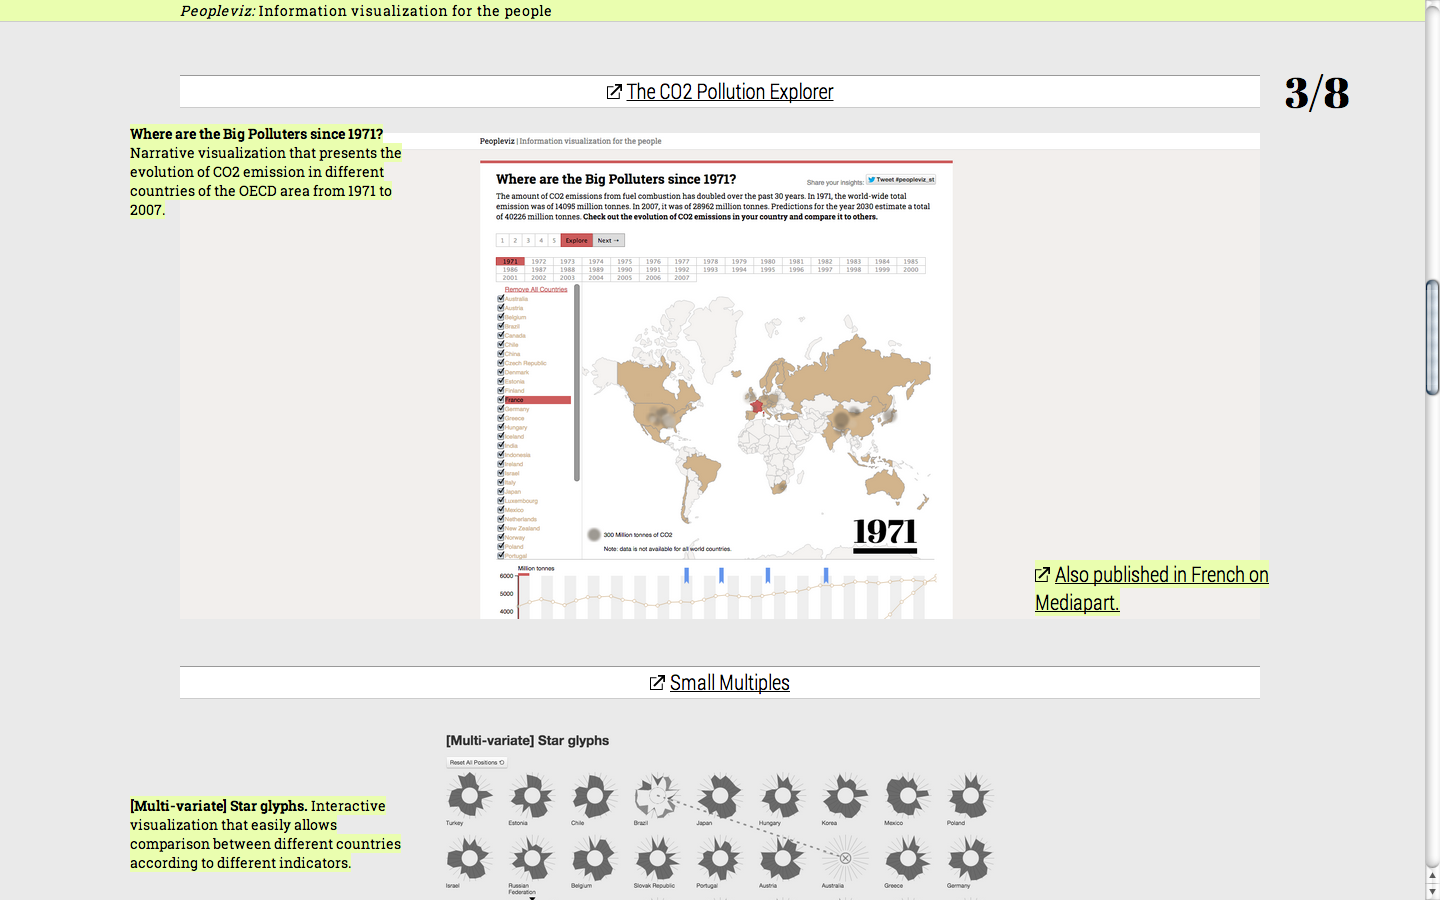 Peopleviz: Information visualization for the people. |
 ParcoursVis: Visualization of Patient Pathways |
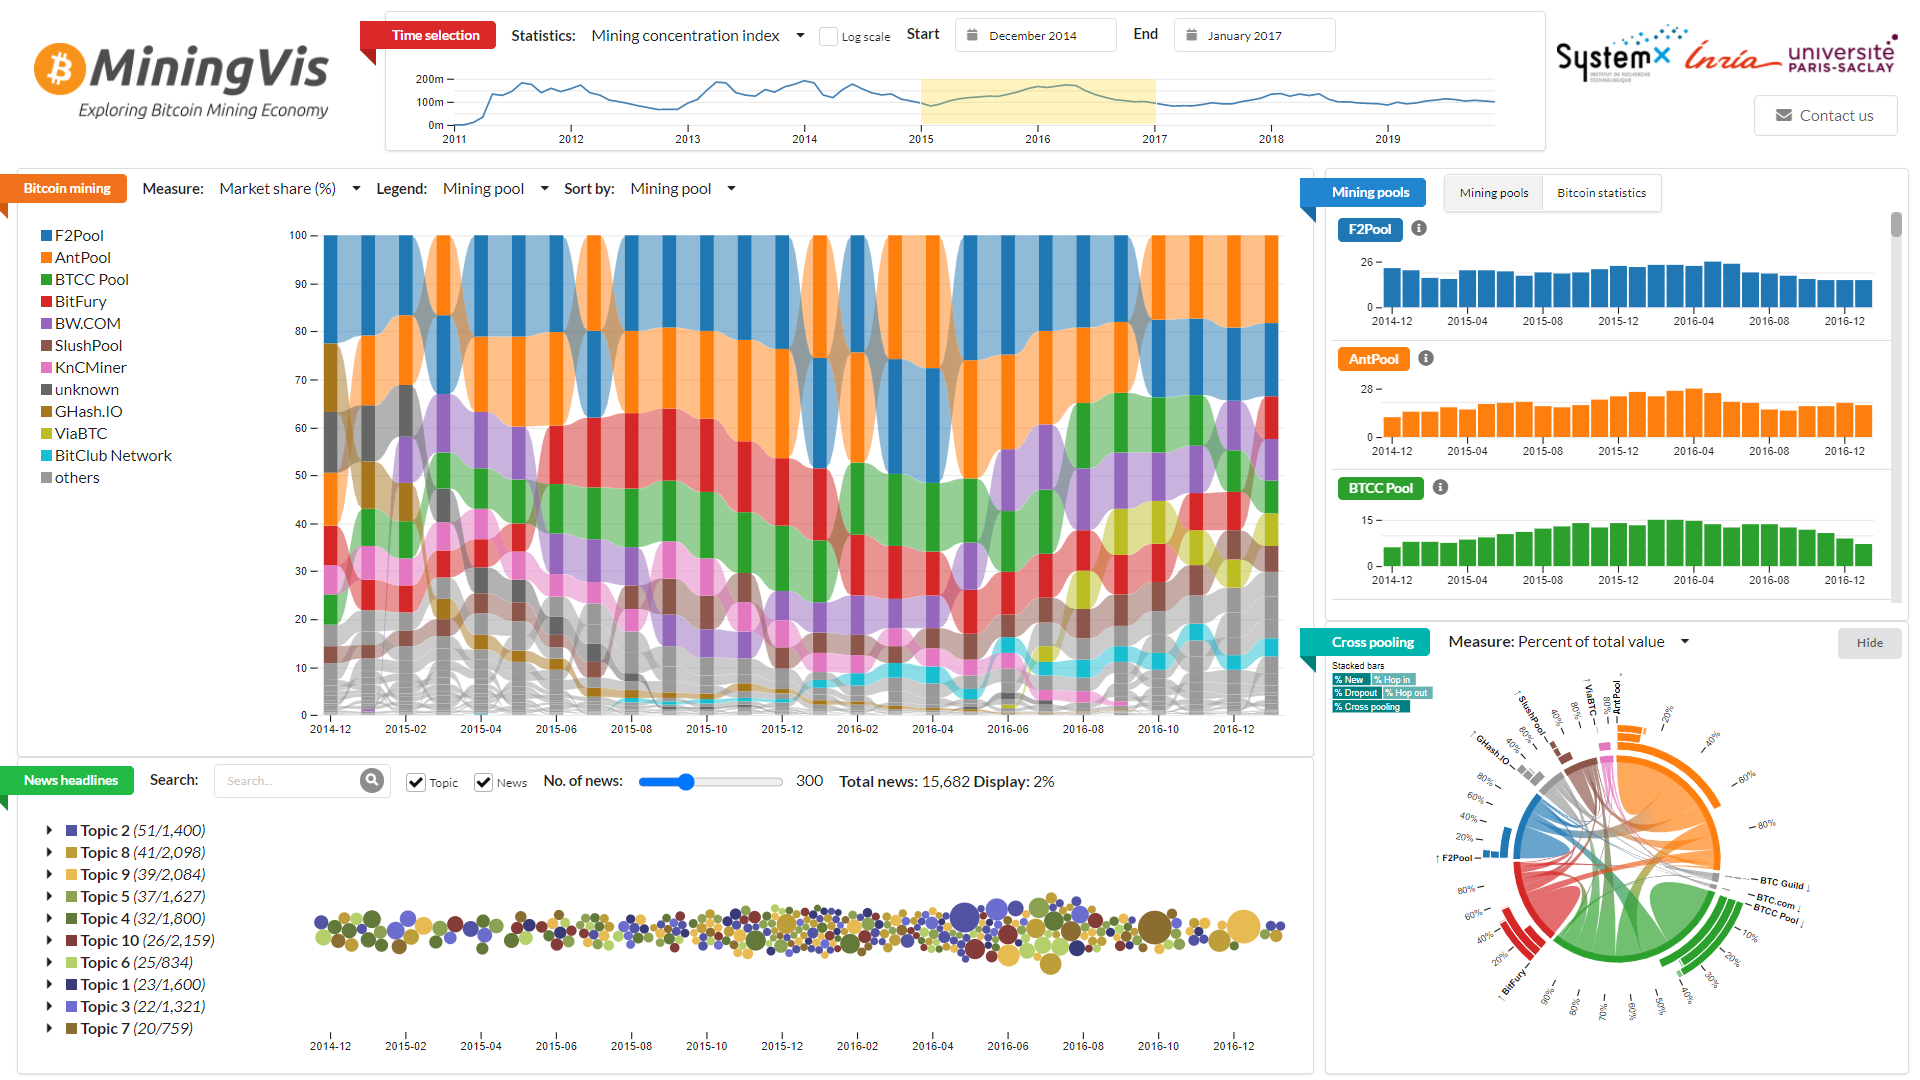 BitcoinVis: Visualization of Bitcoin Data |
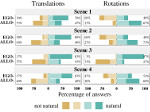
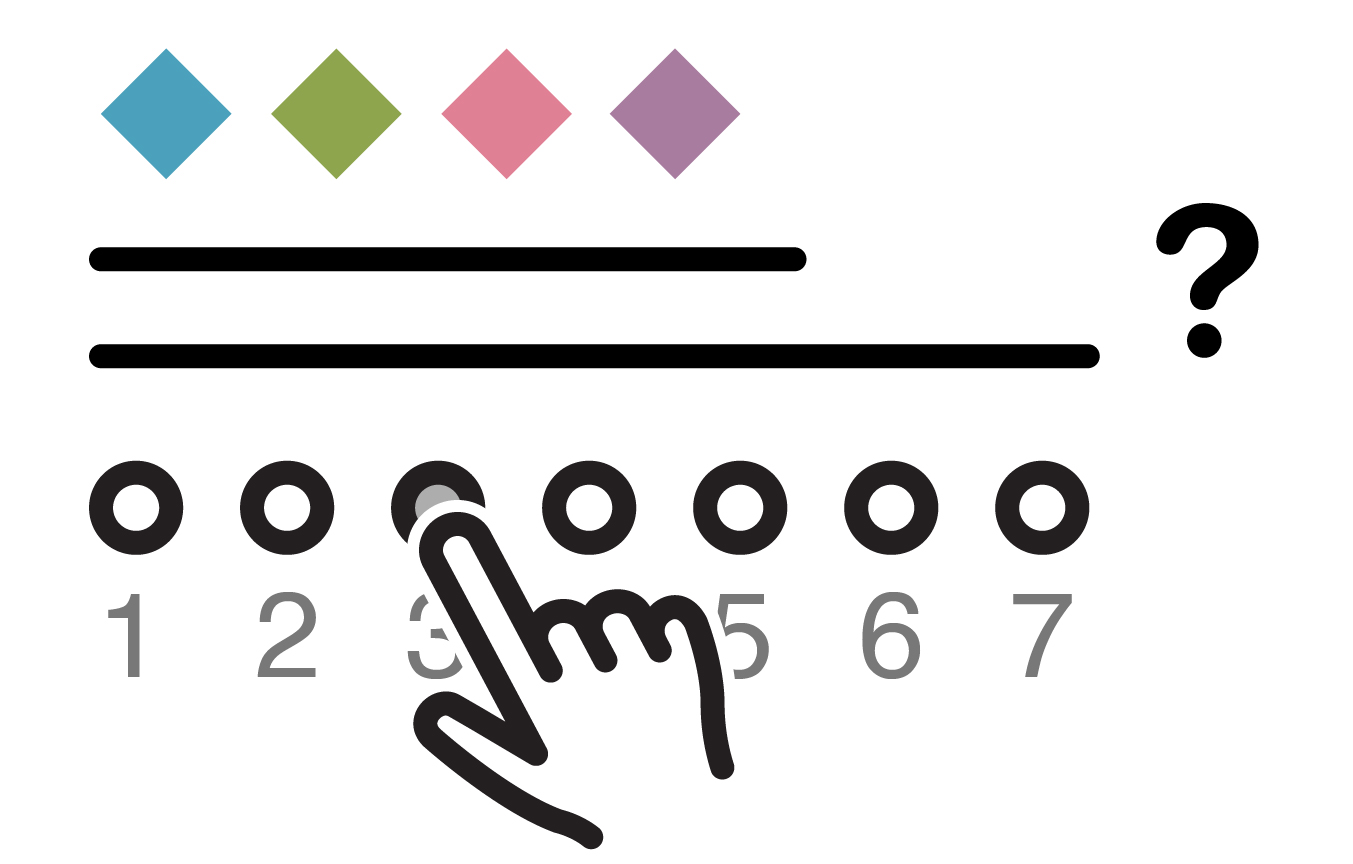
Perception and Cognition
| ||||
| 
| 
| 
| 
|
| 
| 
| 
|
Interaction
 | |||
 |
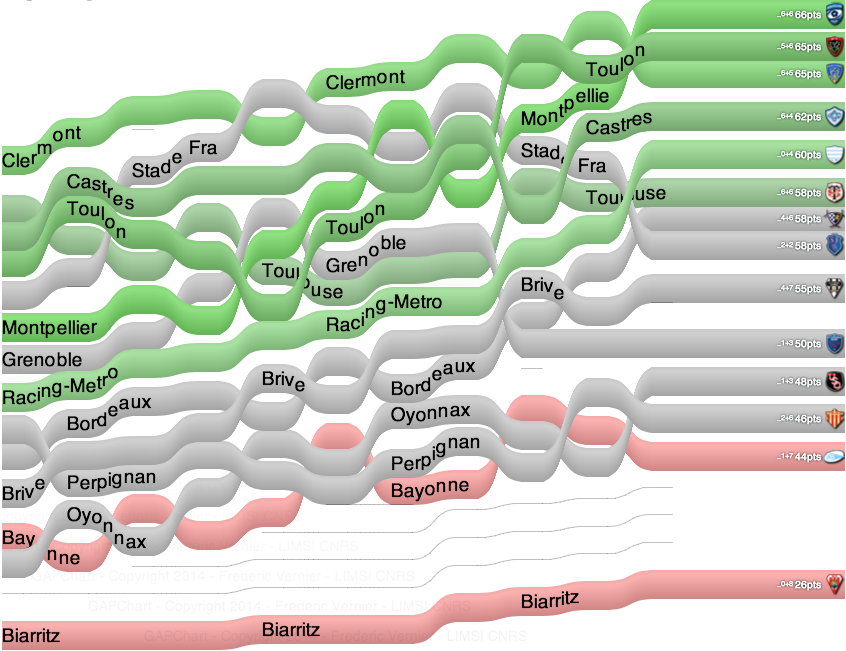
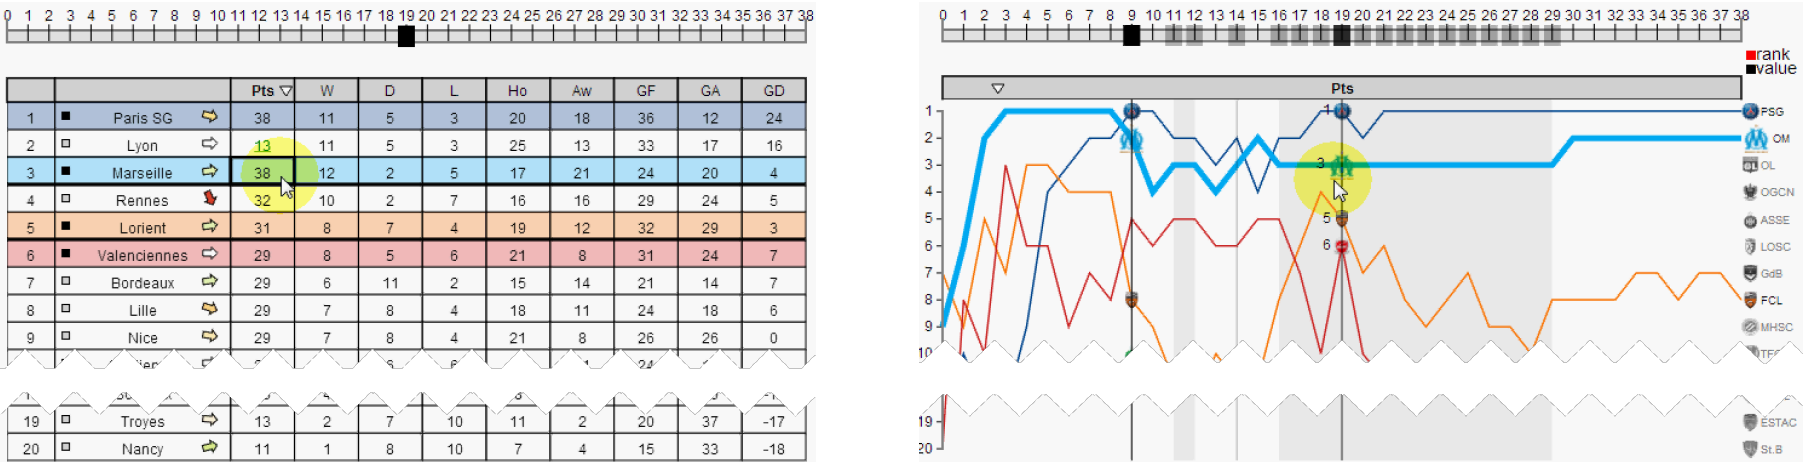 A Table! Improving Temporal Navigation in Soccer Ranking Tables |
 | |
 | |||
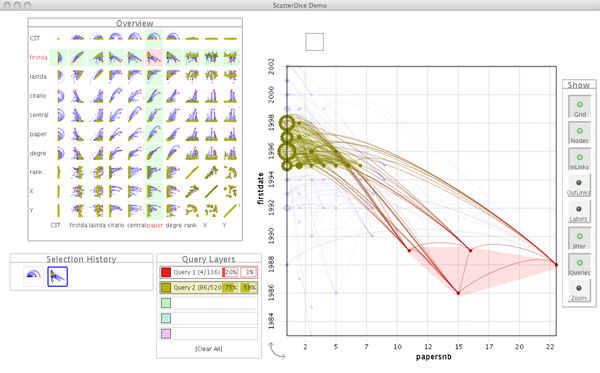
- Scatterdice (web version)
- EvoGraphDice
- Dimp (offsite link)
- Jutable
- Motion Pointing
- Georipper (offsite link)
- Small target acquisition (offsite link)
Text and Document Visualization
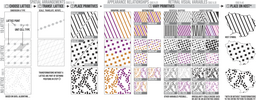
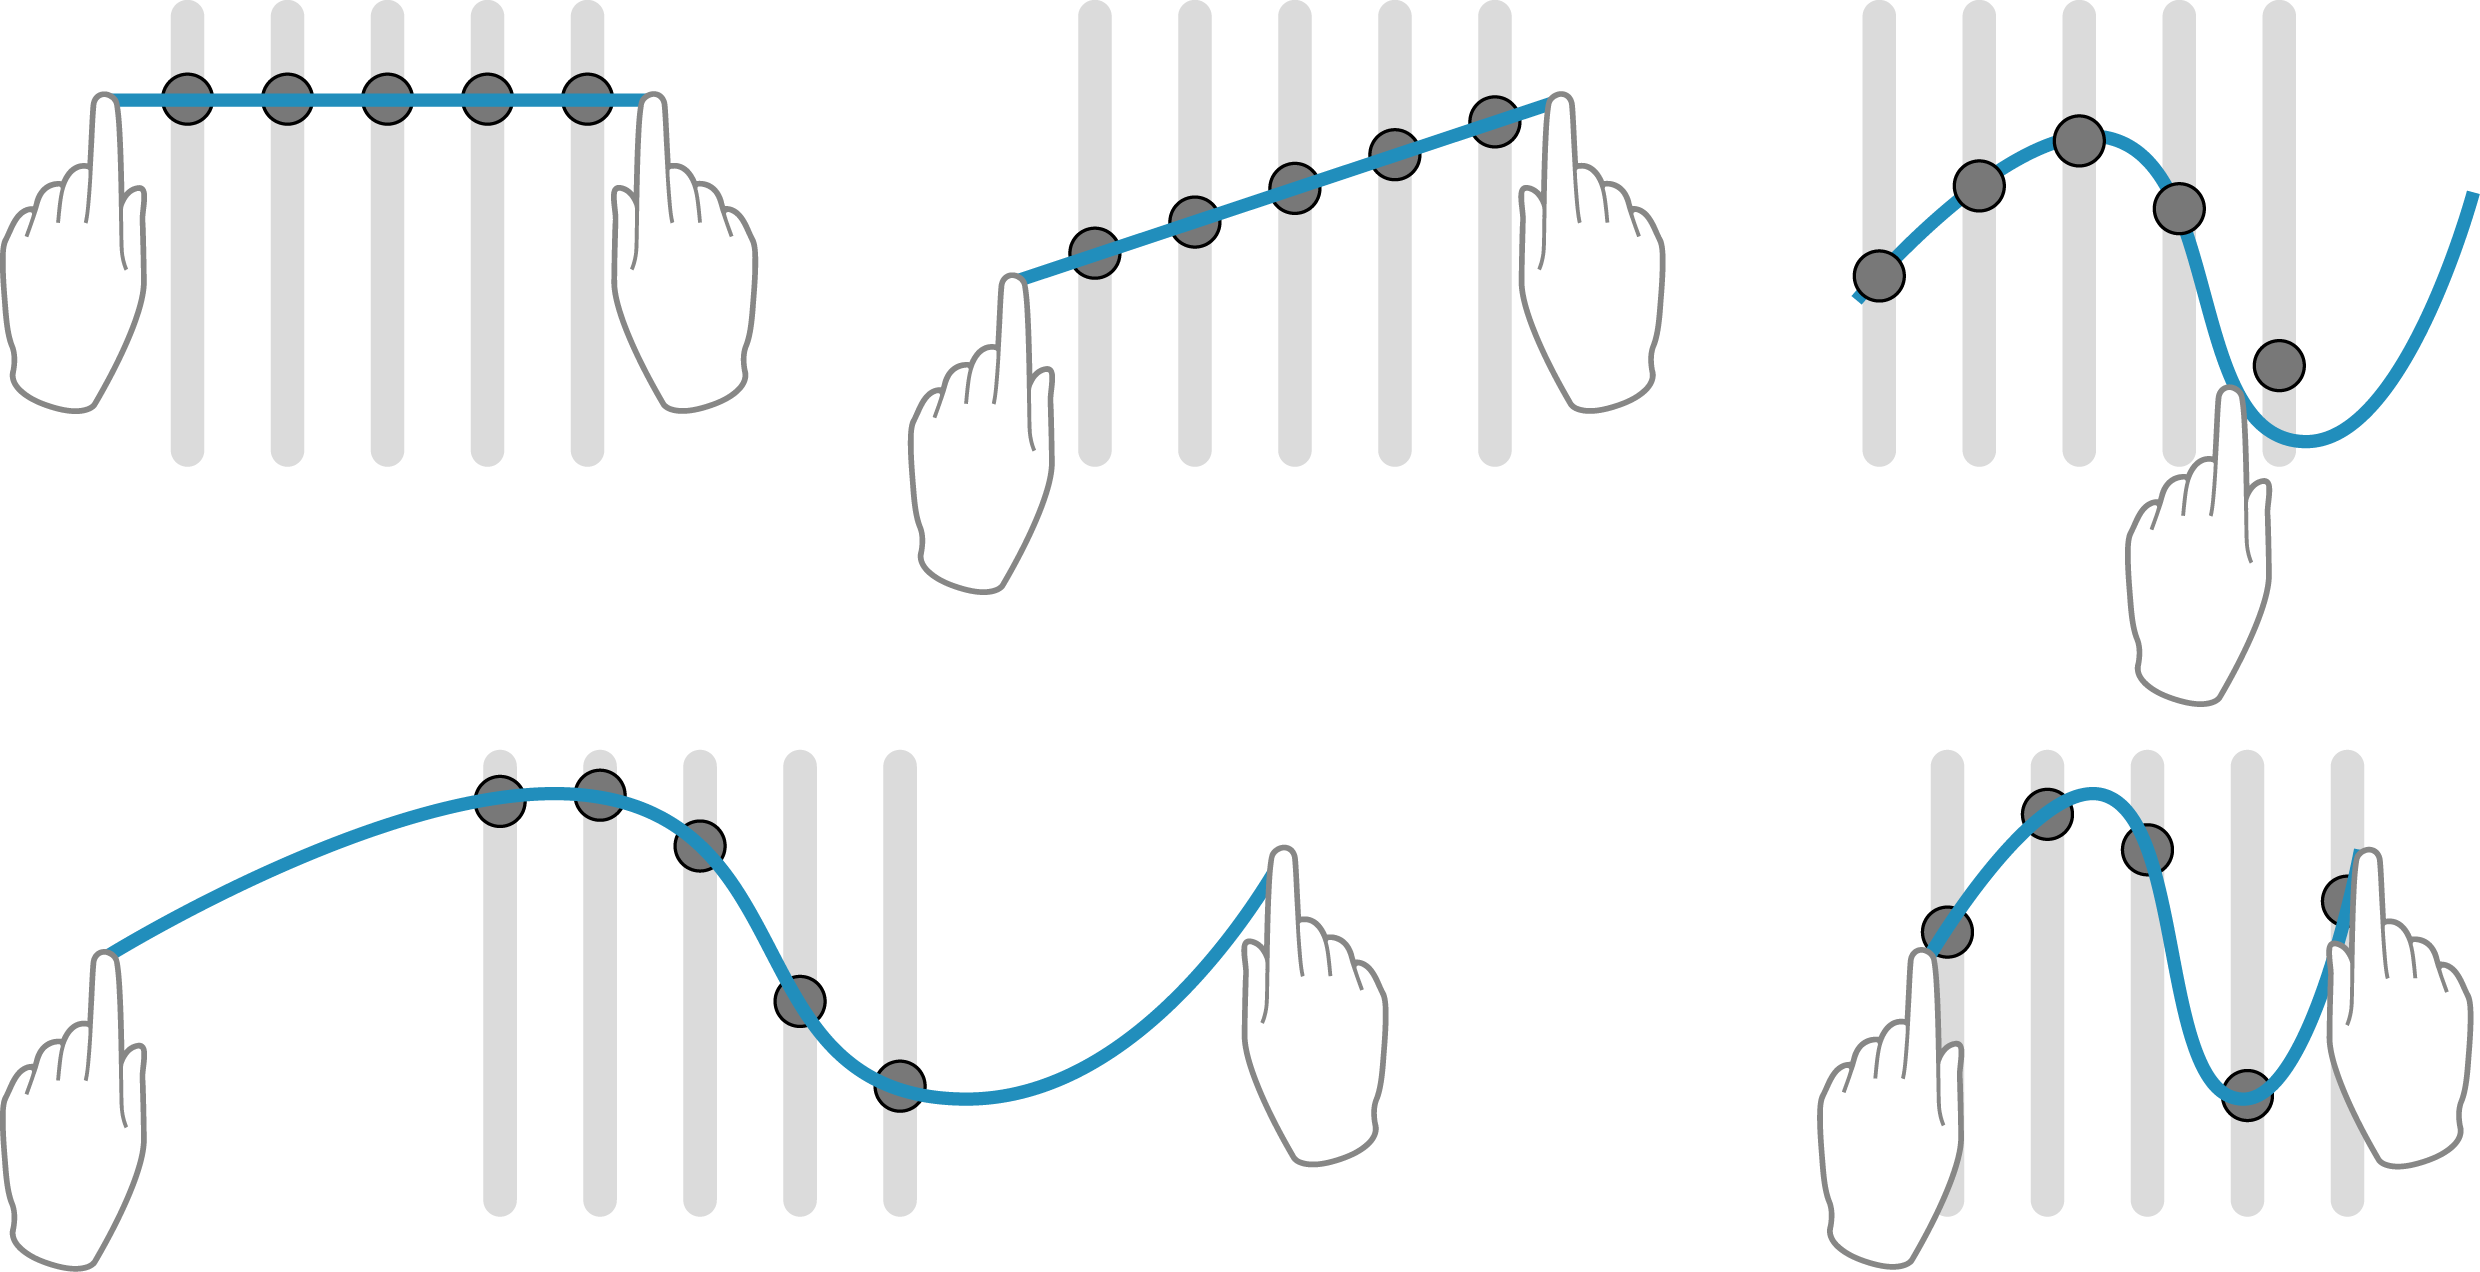
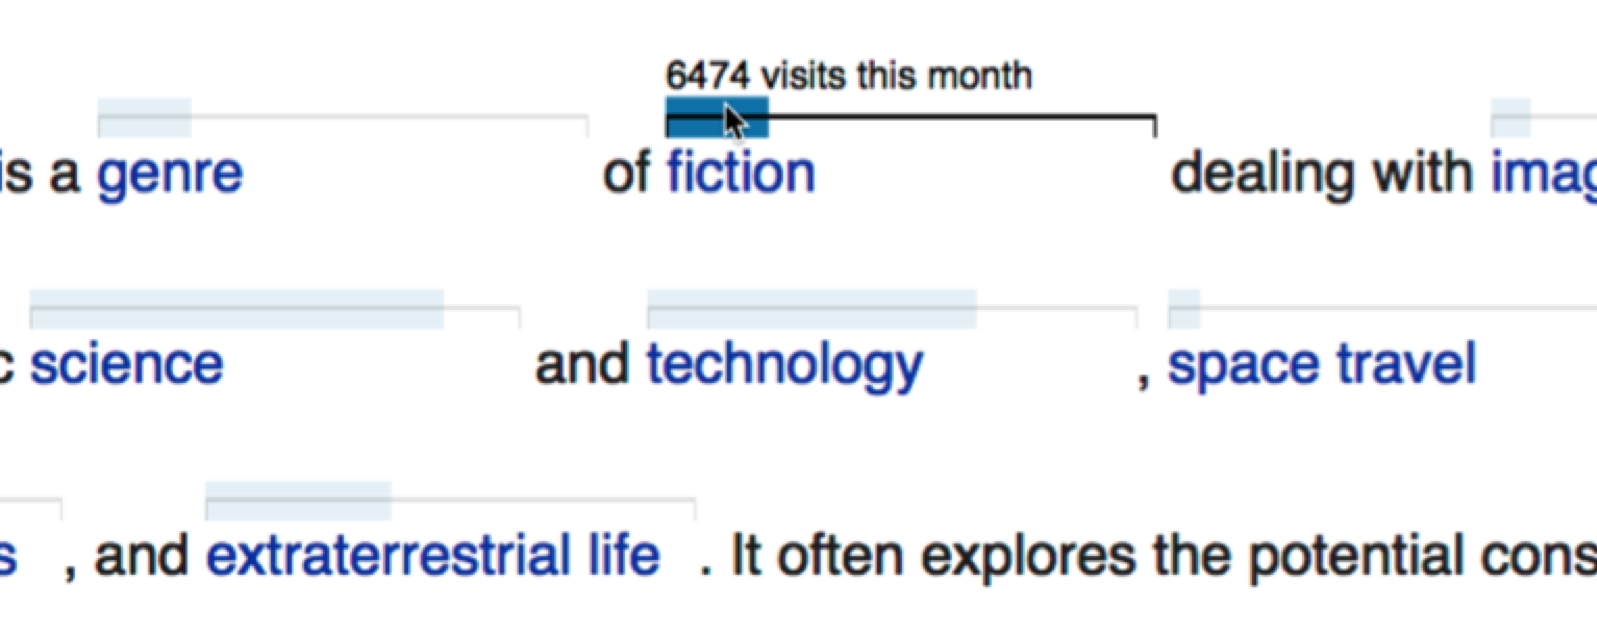 Exploring the Placement and Design of Word-Scale Visualizations |
 | |
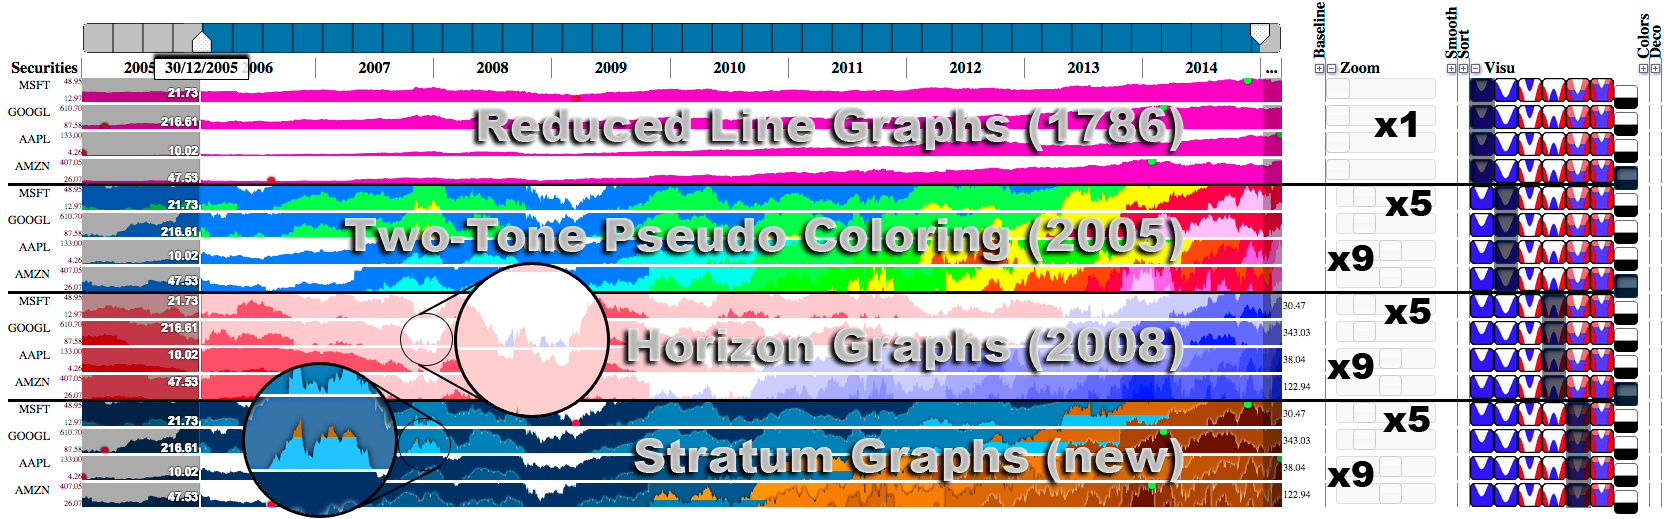
Visualization for Temporal Data
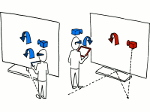
Collaboration
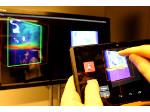
Image Exploration
Software Infrastructure
- ProgressiVis: ProgressiVis: A Python Toolkit for Progressive Data Analysis and Visualization
- Progressive Data Analysis: A new computation paradigm for interactively exploring data at scale
- The InfoVis Toolkit: A Java Toolkit for Information Visualization (offsite link)
- EdiFlow: Reactive Workflow for Visual Analytics (offsite link)
- Obvious: A Toolkit to Wrap Java InfoVis Toolkit (offsite link)
- Java VisTrails: Integrating Java Toolkits in VisTrails (offsite link)
- Java VisTrails: Integrating Java Toolkits in VisTrails (offsite link)
- Visual Sedimentation: A JavaScript library for visualizing streaming data, inspired by the process of physical sedimentation.(offsite link)
Casual Visualization
 SpiraClock: A continuous and non-intrusive display for upcoming events |
 SpiroViz: Spirograph Designs for Ambient display of Tweets |
 Noise of chaos: Show statistics through rythmes. |
Methodology
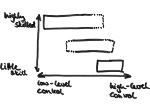
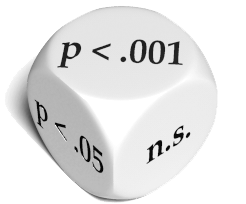 Running an HCI Experiment in Multiple Parallel Universes: can p-values be trusted? |
Current Funded Research Projects
SEVEN - Inria / Calgary Associated Team on Situated and Embedded Visualization
The goal of the associated team is to understand how situated visualizations can help support data analysis and exploration. We will examine how to provide more immediate and situationally-appropriate ways of interacting with health data in particular. The team website has more information
Passed Funded Research Projects
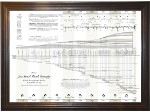
CENDARI
The Collaborative EuropeaN Digital Archive Infrastructure (CENDARI) will provide and facilitate access to existing archives and resources in Europe for the study of medieval and modern European history (specifically the First World War period) through the development of an ‘enquiry environment’. This environment will increase access to records of historic importance across the European Research Area, creating a powerful new platform for accessing and investigating historical data in a transnational fashion overcoming the national and institutional data silos that now exist.
Connect, Collaborate, Analyze : From Individual Work to Collaborative Visual Analytic (FITOC)
 | This project focuses on visualization research and the notion of data analysis as a social process. Currently, a large amount of data analysis work is conducted by individuals but many activities require the switch to collaborative data analysis with others. The goal of this project is to research how the transition between individual and collaborative work can best be supported using visualization applications. For more details, please see the project page |
DREAM
DREAM (Design and development of REAlistic food Models with well-characterised micro- and macro-structure and composition) is an FP7 european project, that involves 18 partners from 9 european countries, among which two multinationals. The project is lead by INRA. Our contribution to this project is focussed on the evolutionary optimisation of Bayesian Networks models.
Complex System Design Lab (CSDL)
 | CSDL, Complex Systems Design Lab (2009–2012) is a project of the System@tic pole whose main contractor is Dassault Aviation, together with 27 academic and industrial partners. The aim of CSDL is to settle a complete collorative environment for decision making in the framework of complex systems design> |
Google Grant
Jean-Daniel Fekete receives a Google Research Award for a project called Data Visualization for the People to be done with Jeremy Boy and Aviz. The first part of this project focusses on visualizing the 2012 French presidential elections.
State of the Art
- Temporal Data
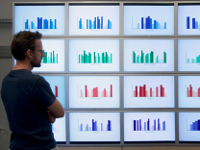
- The Value of Information Visualization
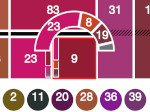
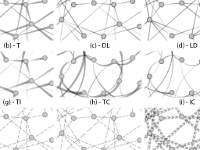
- Matrix Reordering Techniques
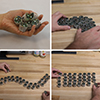
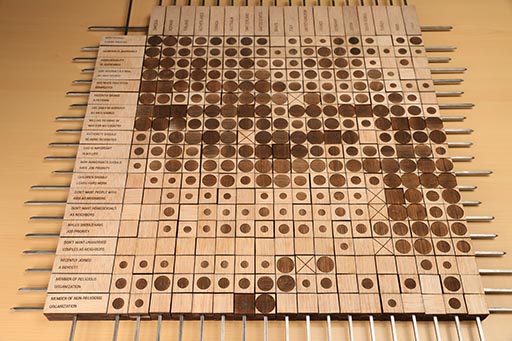
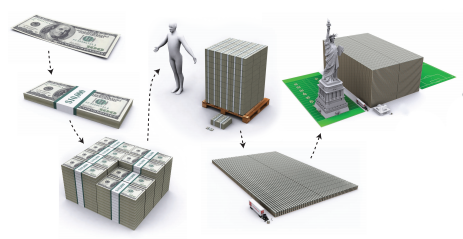
- List of physical visualizations
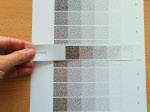
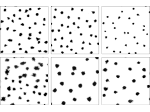
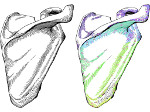
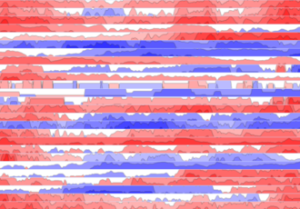
Visualization of or with Sketchiness, Uncertainty, Data Error, or Data Bias
 |
 |
 |
 |