Design Characterization for Black-and-White Textures in Visualization
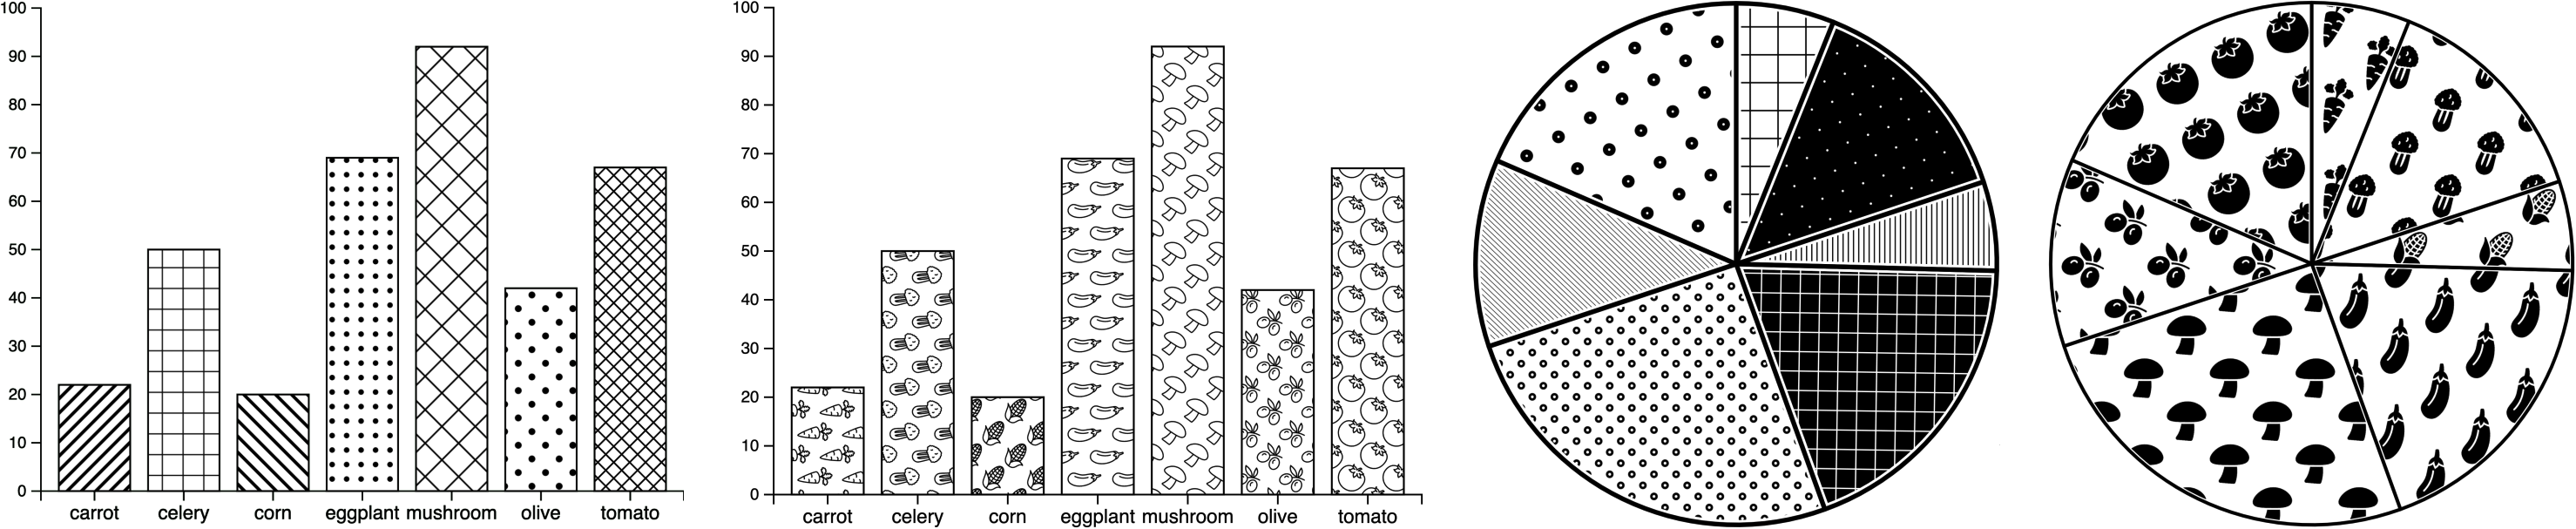
We investigate the use of 2D black-and-white textures for the visualization of categorical data and contribute a summary of texture attributes, and the results of three experiments that elicited design strategies as well as aesthetic and effectiveness measures. Black-and-white textures are useful, for instance, as a visual channel for categorical data on low-color displays, in 2D/3D print, to achieve the aesthetic of historic visualizations, or to retain the color hue channel for other visual mappings. We specifically study how to use what we call geometric and iconic textures. Geometric textures use patterns of repeated abstract geometric shapes, while iconic textures use repeated icons that may stand for data categories. We parameterized both types of textures and developed a tool for designers to create textures on simple charts by adjusting texture parameters. \hty{30 visualization experts used our tool and designed 66 textured bar charts, pie charts, and maps.} We then had 150 participants rate these designs for aesthetics. Finally, with the top-rated geometric and iconic textures, our perceptual assessment experiment with 150 participants revealed that textured charts perform about equally well as non-textured charts, and that there are some differences depending on the type of chart.
Researchers
Links
- Paper download.
- Additional material: Our study materials and data can be found in the following OSF repository: osf.io/n5zut. Our study pre-registrations are at osf.io/r4z2p, osf.io/nyru7, and osf.io/8cy62, respectively.
Video
Paper video:
Pre-conference video:
Main Reference
Tingying He, Yuanyang Zhong, Petra Isenberg, and Tobias Isenberg (2024) Design Characterization for Black-and-White Textures in Visualization. IEEE Transactions on Visualization and Computer Graphics, 30(1):1019–1029, January 2024.