Query and Comparison of Bipartite Multivariate Dynamic Social Networks
Description
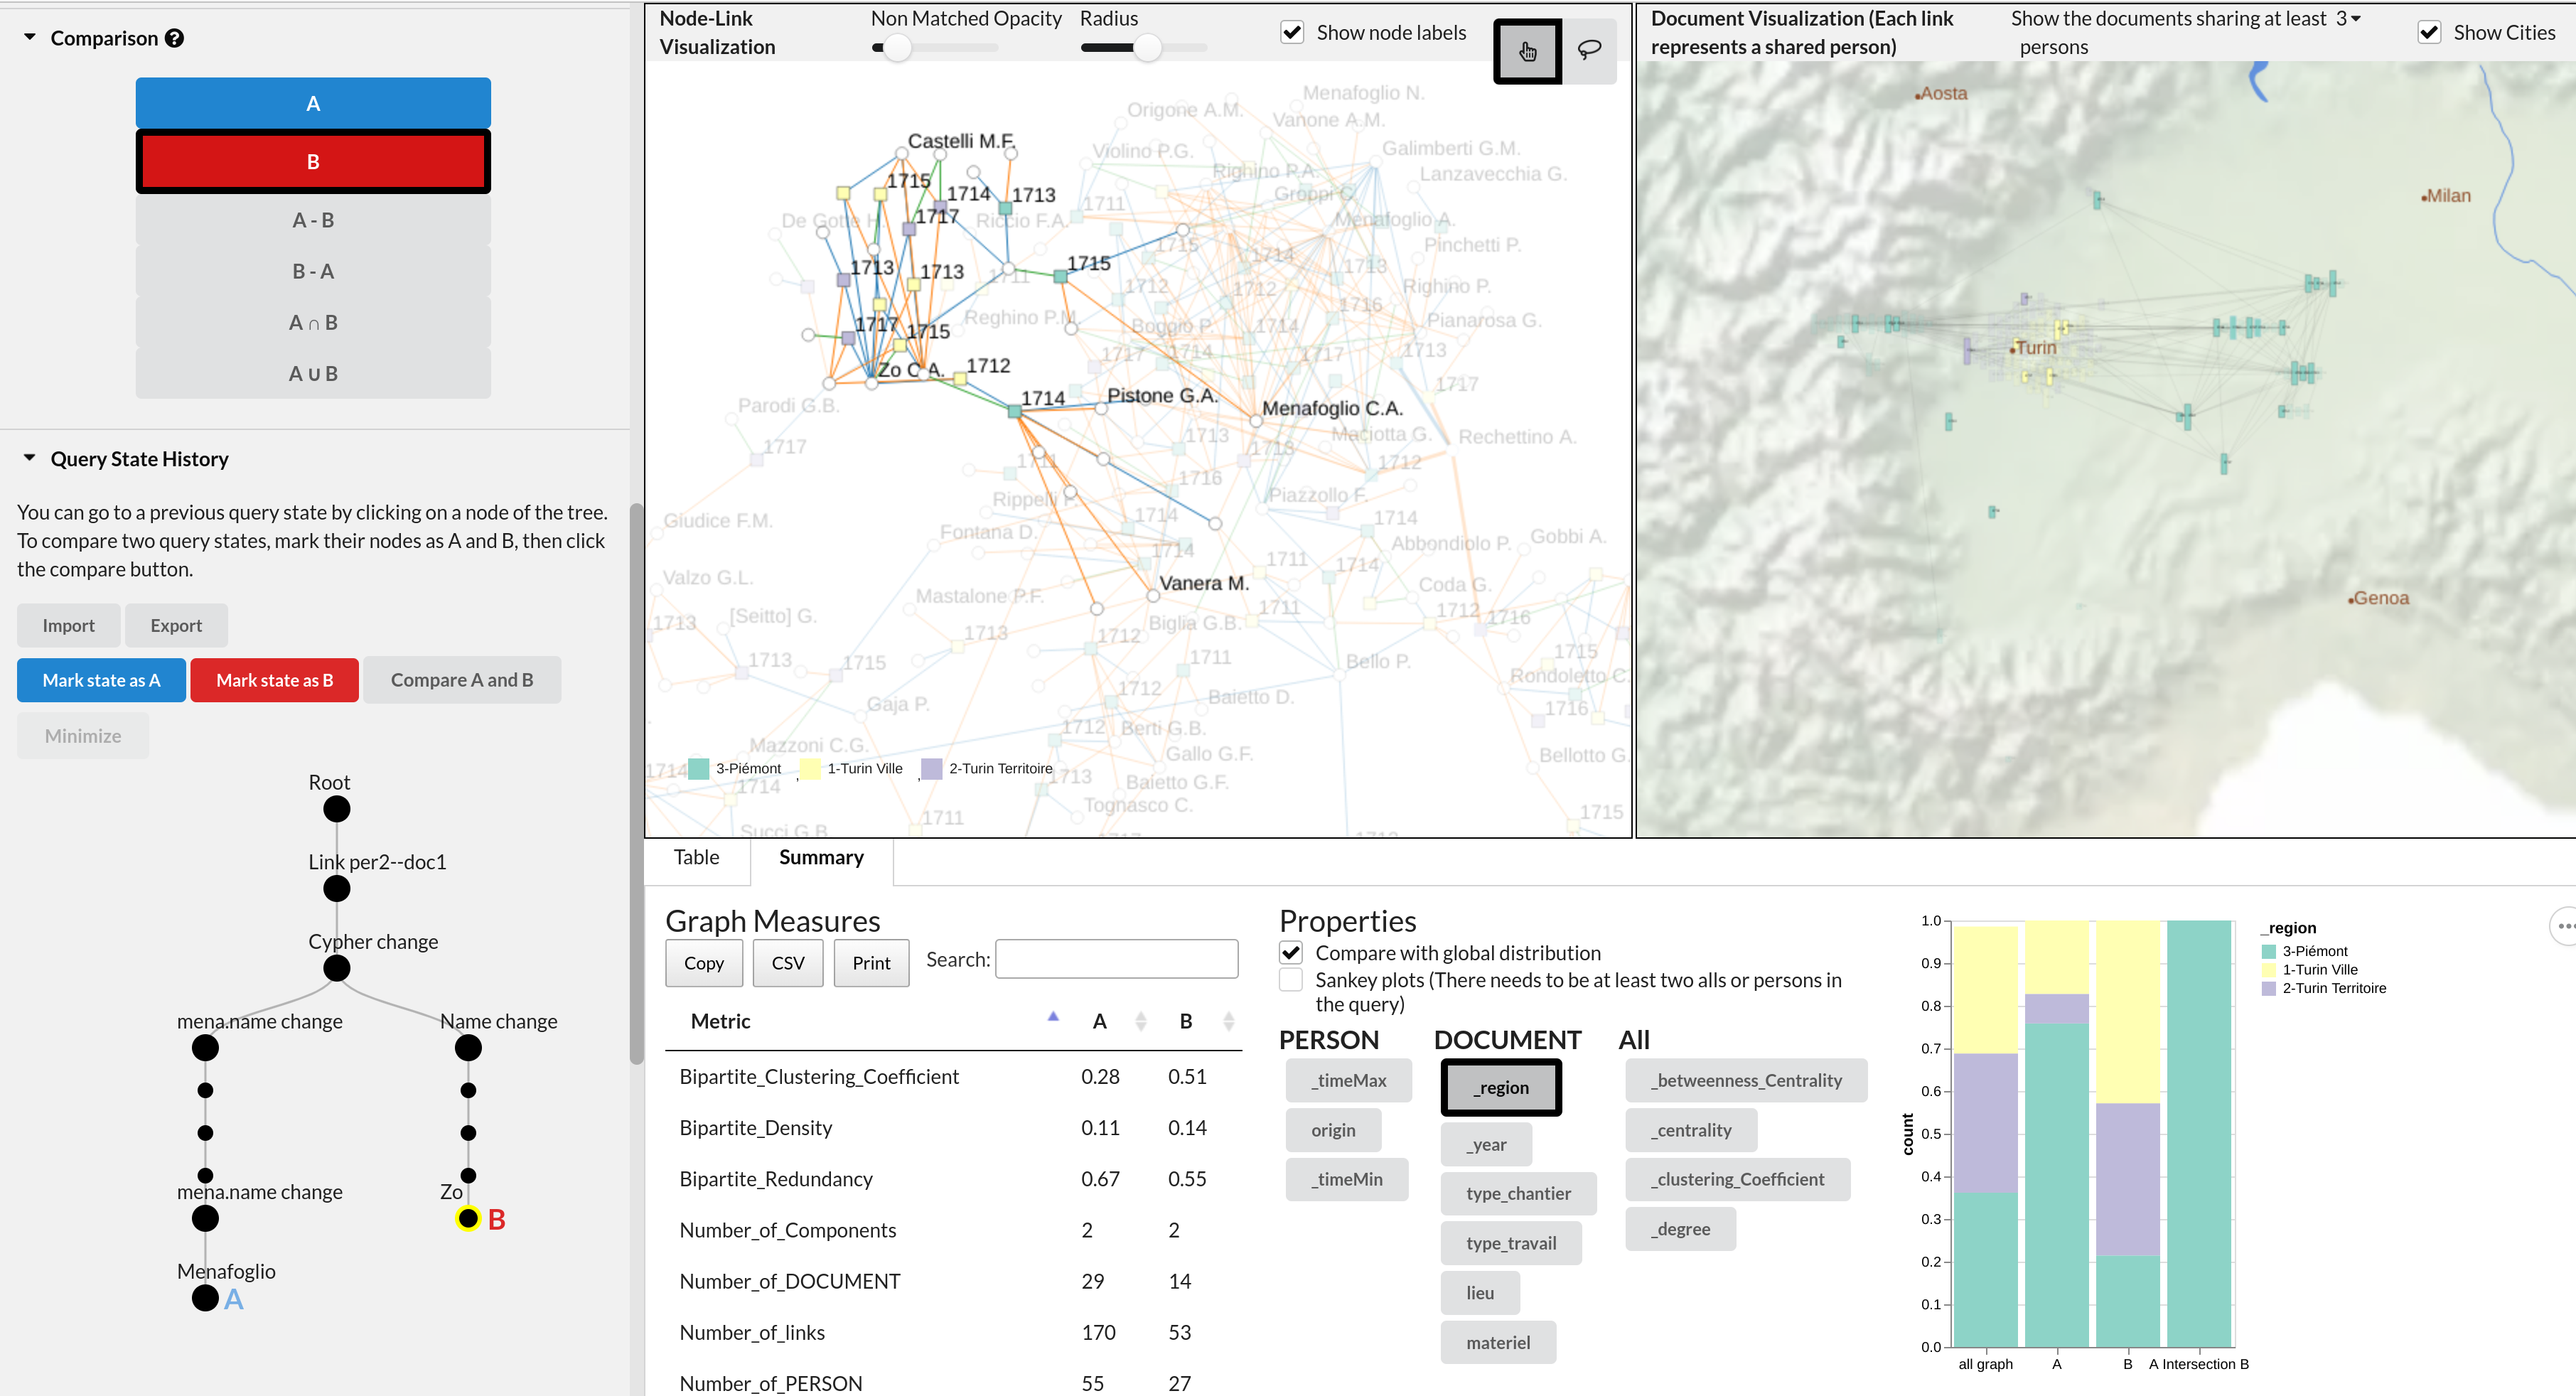
ComBiNet is a visualization, visual query, and comparison system for exploring data modeled as a bipartite multi-variate dynamic social network. Historians and sociologists study social networks constructed from textual sources referencing events related to people, such as marriage acts, birth certificates, or contracts. However, converting textual sources to social networks remains difficult, in part because there is no consensual data model for encoding social networks. Our data model unifies several existing popular data models specifically for socio historical networks. It relies on concrete documents to ground the relations between people, and to ensure an objective and verifiable encoding of the network. Relying on our data model, QCompNet allows exploring social networks using both visual queries and textual queries in the Cypher language, the two being synchronized to specify queries using the most suitable modality; simple queries are easy to express visually and can be refined textually when they become complex. These queries are used for applying topological and attribute-based selection on the network. Query results are visualized in the context of the whole network and also over a geographical map for geolocalized entities. We also provide novel interactions to compare network selections in terms of network measures, attribute distributions,and comparative visualizations. We present the design of our novel interaction techniques for querying and comparing social networks and validate them by showing how they have been used to answer several historical questions raised by
Online Demo
You can play with a web prototype of the program by clicking on this link.
Local Use
It is possible to launch the application locally, using docker and docker-compose. To install those check this link and this one.
You then have to download the docker-compose.yml file and launch it with docker-compose. On linux you have to run the command "sudo docker-compose up" on the terminal in the same folder than the docker-compose.yml file. The application then takes a little bit of time to launch. Once it is done, it is accessible at http://localhost:1234 on any web browser.
Manual
A french user manual is available here : https://docs.google.com/document/d/1WyuwTy5Fel8pdRFjdVnzzidJBr-9IoHlrVUypYS2Jkc/edit?usp=sharing
Format
The application takes as an input a bipartite graph in the following Json format :
 {
   "metadata": {
     "edgeType": [name of the edge type key in each edge item]
     "entityType": [name of the node type key in each node item]
     "time_key": [name of the time key in each document node]
     "source_entity_type": [name of the document node type]
     "target_entity_type": [name of the person node type]
   },
   "nodes": [...],
   "edges": [...]
 }
Each node is in the format {"id": ..., [entityType]: ..., }, with potential other attributes. Each document node have the time stored in the [time_key] attribute, and can have latitude and longitude attributes. Each edge is in the format {"source": [source node id], "target": [target node id], [edgeType]: ...}, with potential other attributes.
Acknowledgements
This work has been funded by the DATAIA HistorIA project. We want to thank our collaborators Nicole Dufournaud and Pascal Cristofoli.