Gender in 30 Years of IEEE Visualization
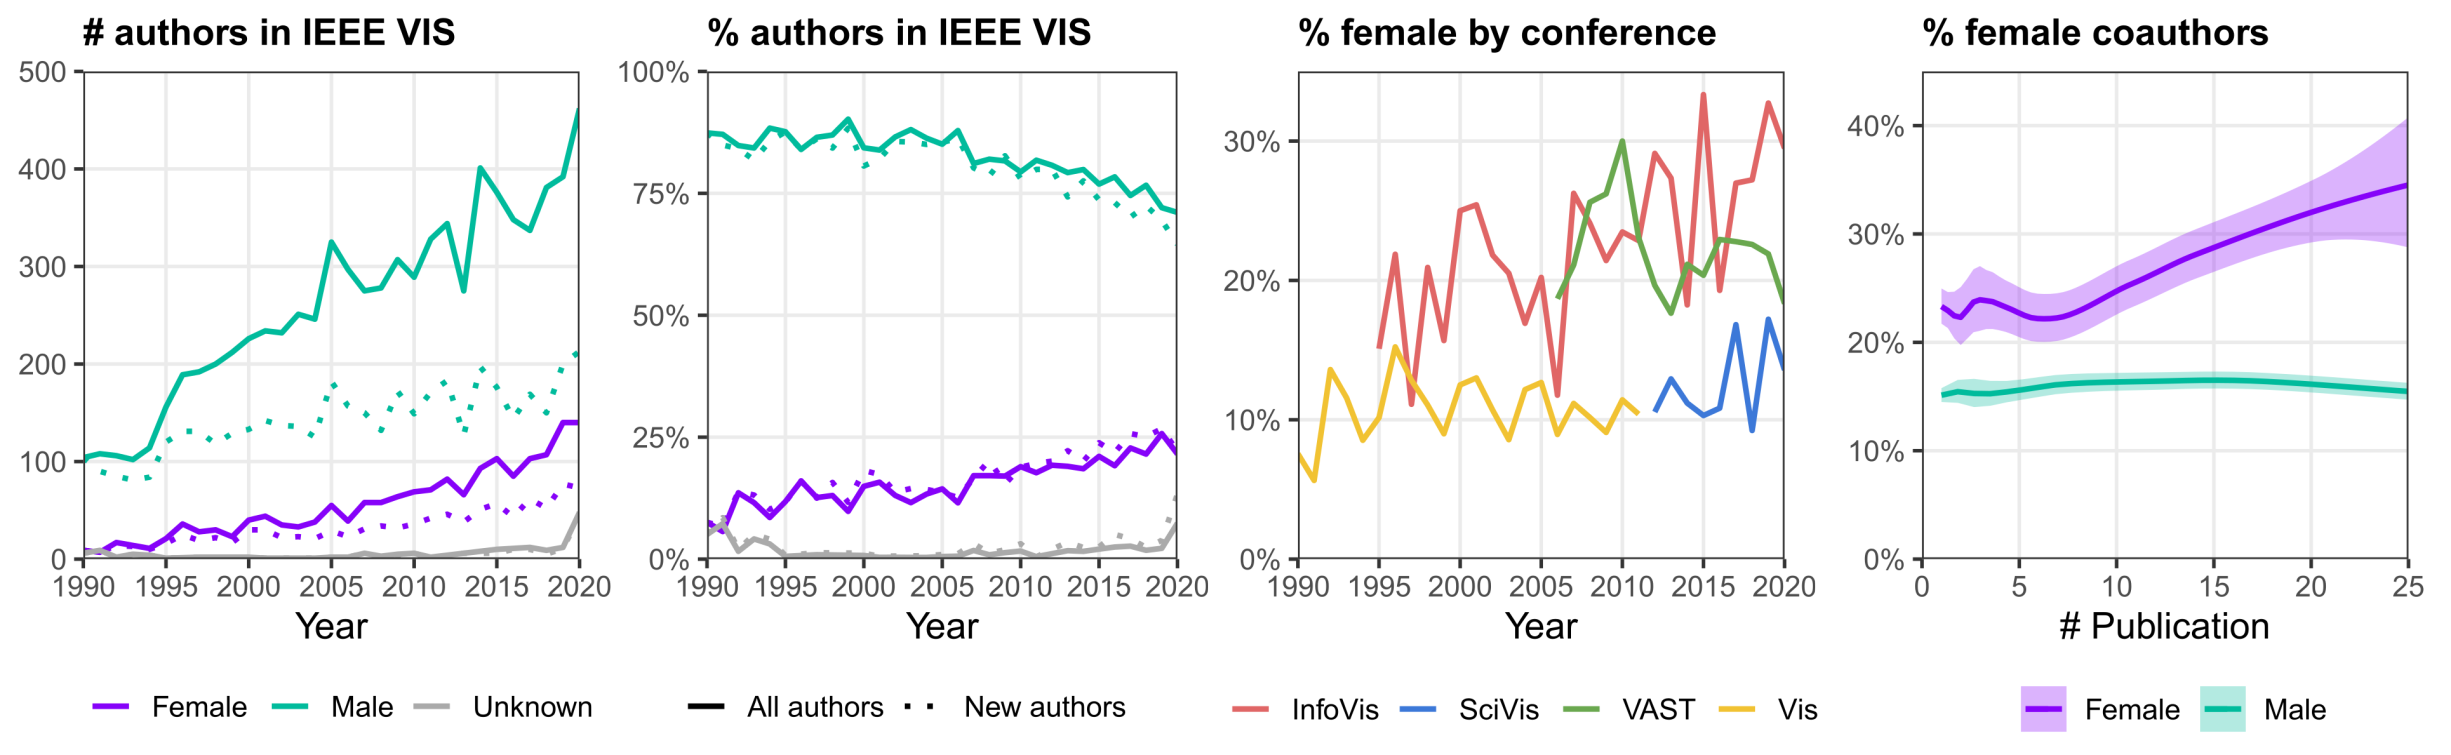
Figure description (from left to right): (# authors in IEEE VIS) Total number of authors per year and gender. (% authors in IEEE VIS) Percentage of authors per year and gender. (% female by conference) Percentage of female authors per year, for each child conference. (% female coauthors) Percentage of female co-authors as a function of paper count, per gender.
Description
We present an exploratory analysis of gender representation among the authors, committee members, and award winners at the IEEE Visualization (VIS) conference over the last 30 years. Our goal is to provide descriptive data on which diversity discussions and efforts in the community can build. We look in particular at the gender of VIS authors as a proxy for the community at large. We consider measures of overall gender representation among authors, differences in careers, positions in author lists, and collaborations. We found that the proportion of female authors has increased from 9% in the first five years to 22% in the last five years of the conference. Over the years, we found the same representation of women in program committees and slightly more women in organizing committees. Women are less likely to appear in the last author position, but more in the middle positions. In terms of collaboration patterns, female authors tend to collaborate more than expected with other women in the community.
Paper
Natkamon Tovanich, Pierre Dragicevic, & Petra Isenberg (2022). Gender in 30 Years of IEEE Visualization. IEEE Transactions on Visualization and Computer Graphics (Special Issue on the Proceedings of IEEE VIS 2021)
Presentation Video
Data
- Visualization publication dataset https://www.vispubdata.org/
- All non-gender related data and all images (with ccby license) from the paper are available on https://osf.io/ydfj4/
- The gender-author matching can be accessed through https://nyu.databrary.org/volume/1301