Concrete Scale: A Practical Framework for Effective Visual Depiction of Complex Measures
|
Description
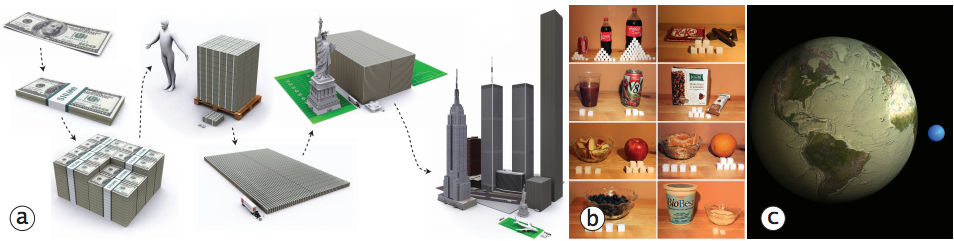
From financial statistics to nutritional values, we are frequently exposed to quantitative information expressed in measures of either extreme magnitudes or unfamiliar units, or both. A common practice used to comprehend such complex measures is to relate, re-express, and compare them through visual depictions using magnitudes and units that are easier to grasp. Through this practice, we create a new graphic composition that we refer to as a concrete scale. To the best of our knowledge, there are no design guidelines that exist for concrete scales despite their common use in communication, educational, and decision-making settings. We attempt to fill this void by introducing a novel framework that would serve as a practical guide for their analysis and design. Informed by a thorough analysis of graphic compositions involving complex measures and an extensive literature review of scale cognition mechanisms, our framework outlines the design space of various measure relations---specifically relations involving the re-expression of complex measures to more familiar concepts---and their visual representations as graphic compositions.
Article
Chevalier, F., Vuillemot R. and Gali G. Concrete Scales: A Practical Framework for the Visual Depiction of Complex Measures. In IEEE Transactions on Visualization and Computer Graphics (Proc. Infovis'13). 19(12):2426-2435. 2013.
IEEE Explore entry 
HAL INRIA entry 
Corpus of our Curated Examples