Lost in Magnitudes: Exploring Visualization Designs for Large Value Ranges
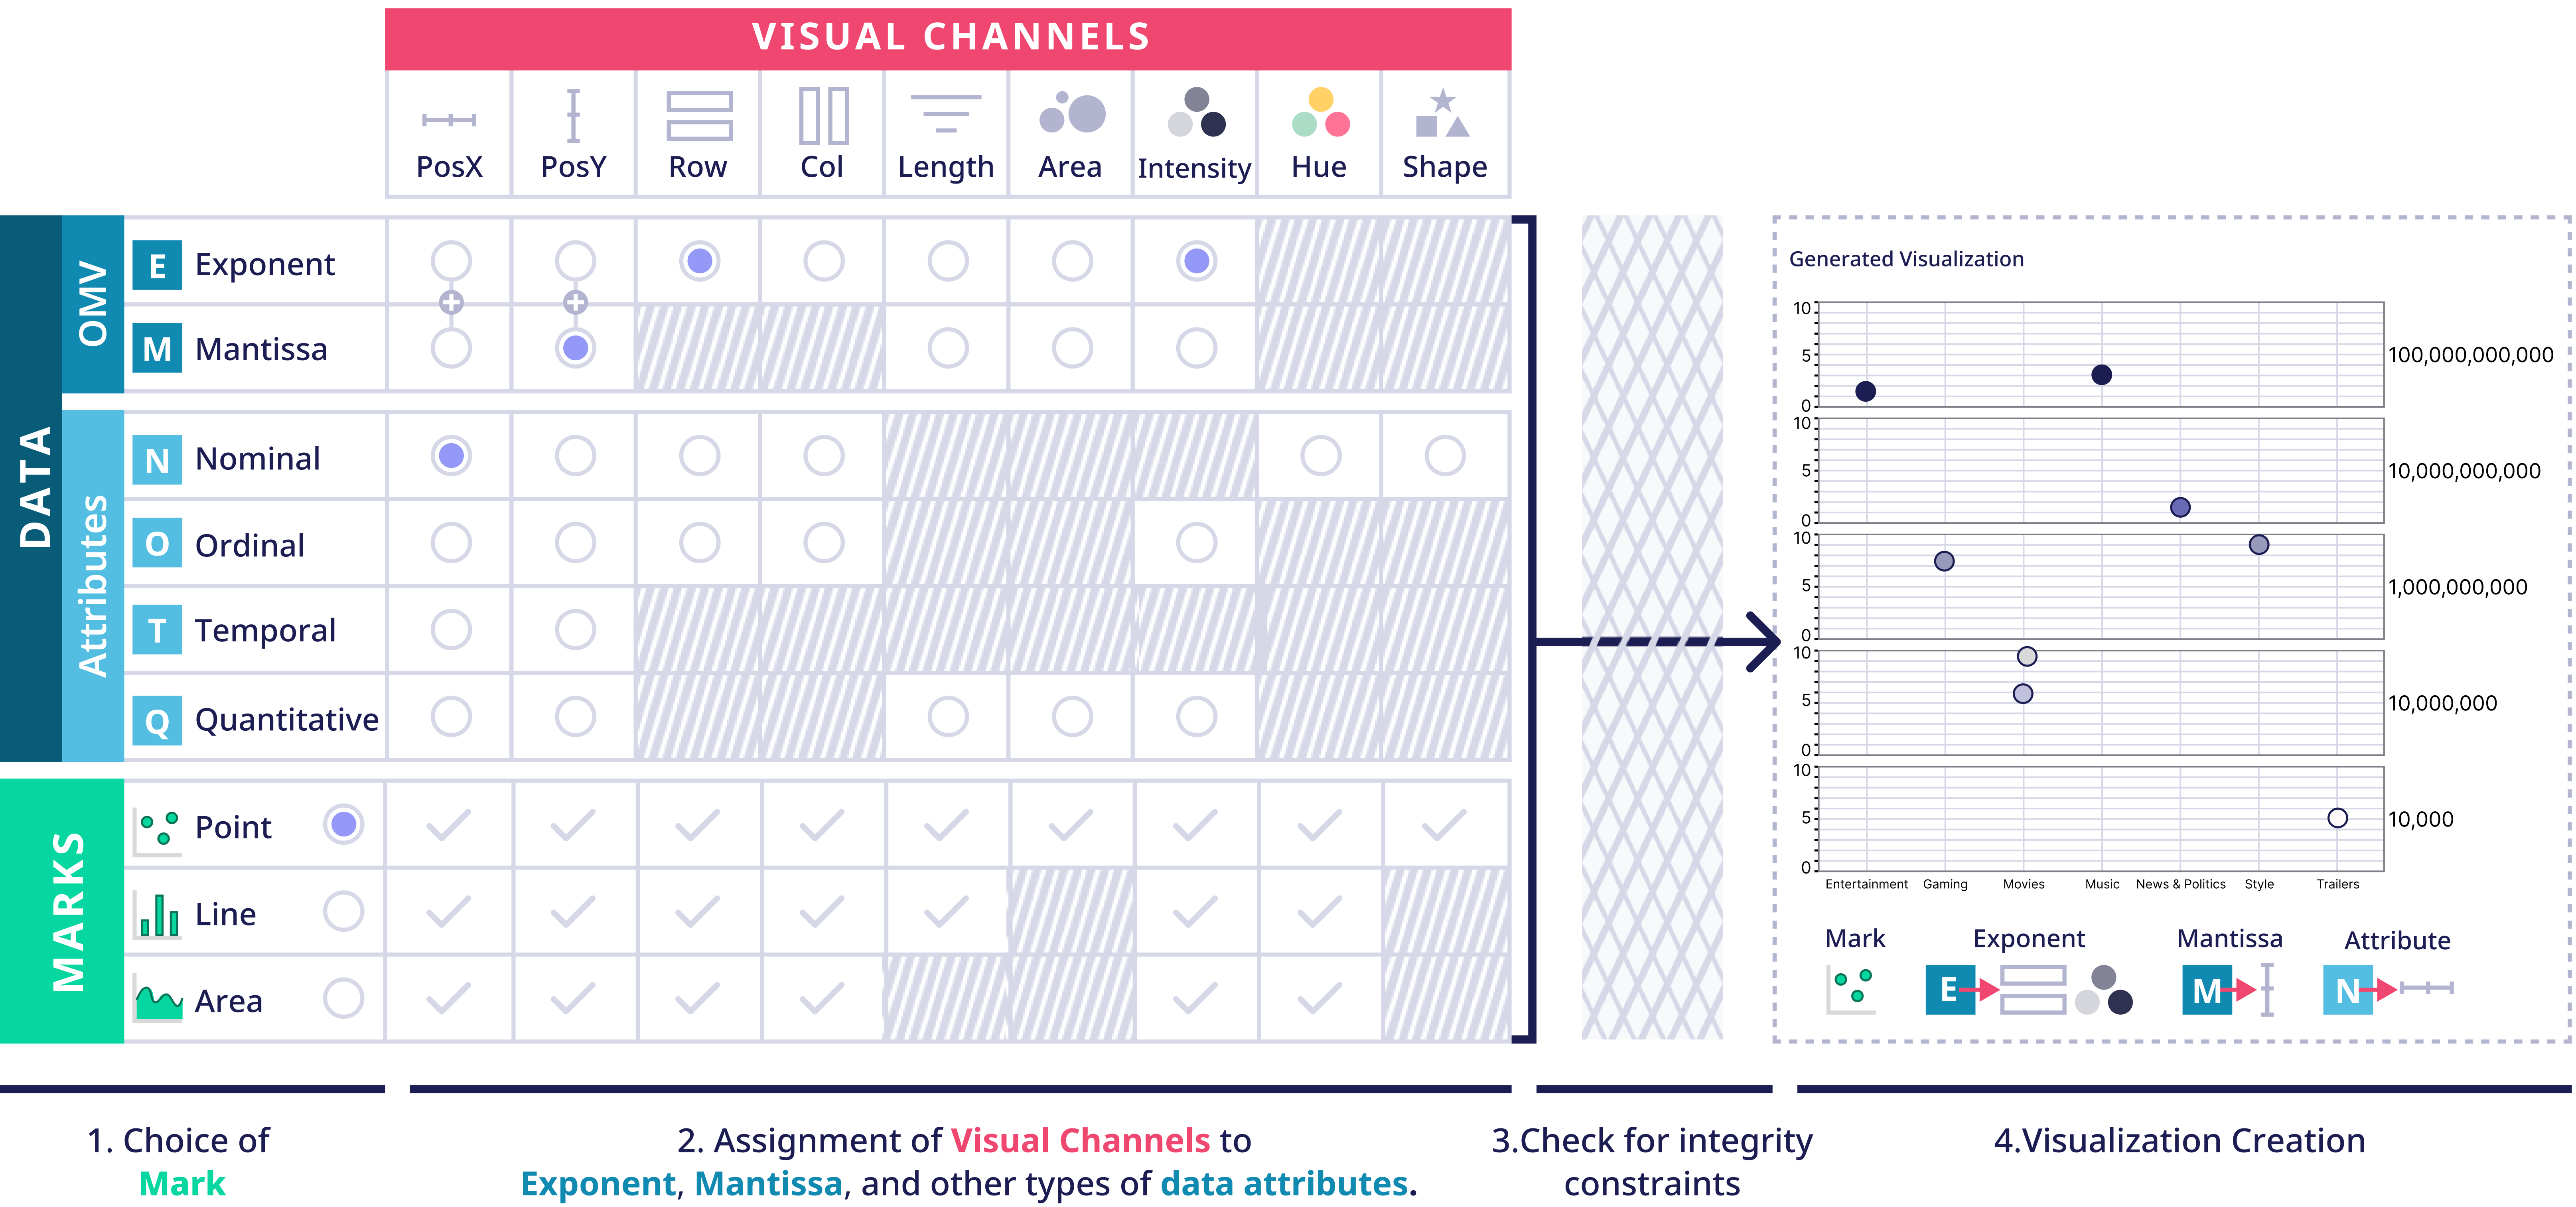
Figure description: Our design space has three dimensions: MARKS (green), DATA (blue), and VISUAL CHANNELS (red). The figure shows an example of using our design space as an interactive table, where a mark is selected, and visual channels are assigned to data attributes. Grey cells are invalid, according to the visualization literature. After checking for integrity constraints, a visualization is generated. Note the + signs (top left); enable the assignment of the EplusM scale to positions.
Description
We explore the design of visualizations for values spanning multiple orders of magnitude; we call them Orders of Magnitude Values (OMVs). Visualization researchers have shown that separating OMVs into two components, the mantissa and the exponent, and encoding them separately overcomes limitations of linear and logarithmic scales. However, only a small number of such visualizations have been tested, and the design guidelines for visualizing the mantissa and exponent separately remain under-explored. To initiate this exploration, better understand the factors influencing the effectiveness of these visualizations, and create guidelines, we adopt a multi-stage workflow. We introduce a design space for visualizing mantissa and exponent, systematically generating and qualitatively evaluating all possible visualizations within it. From this evaluation, we derive guidelines. We select two visualizations that align with our guidelines and test them using a crowdsourcing experiment, showing they facilitate quantitative comparisons and increase confidence in interpretation compared to the state-of-the-art.
We also present a visualization tool to interactively explore viable combinations of marks and visual channels for mantissa and exponent across different datasets, demonstrating the potential of various design combinations for effectively representing OMVs.
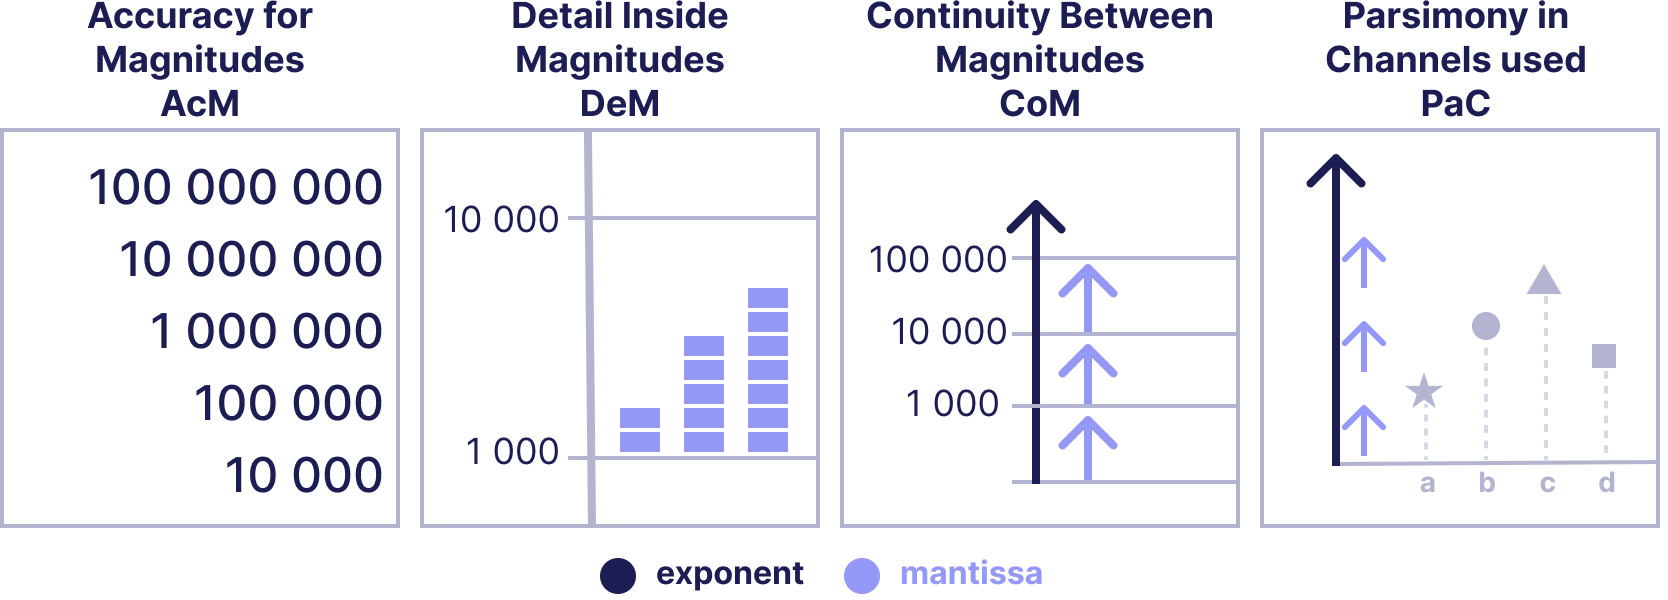
Guidelines for Effective OMVs Visualizations
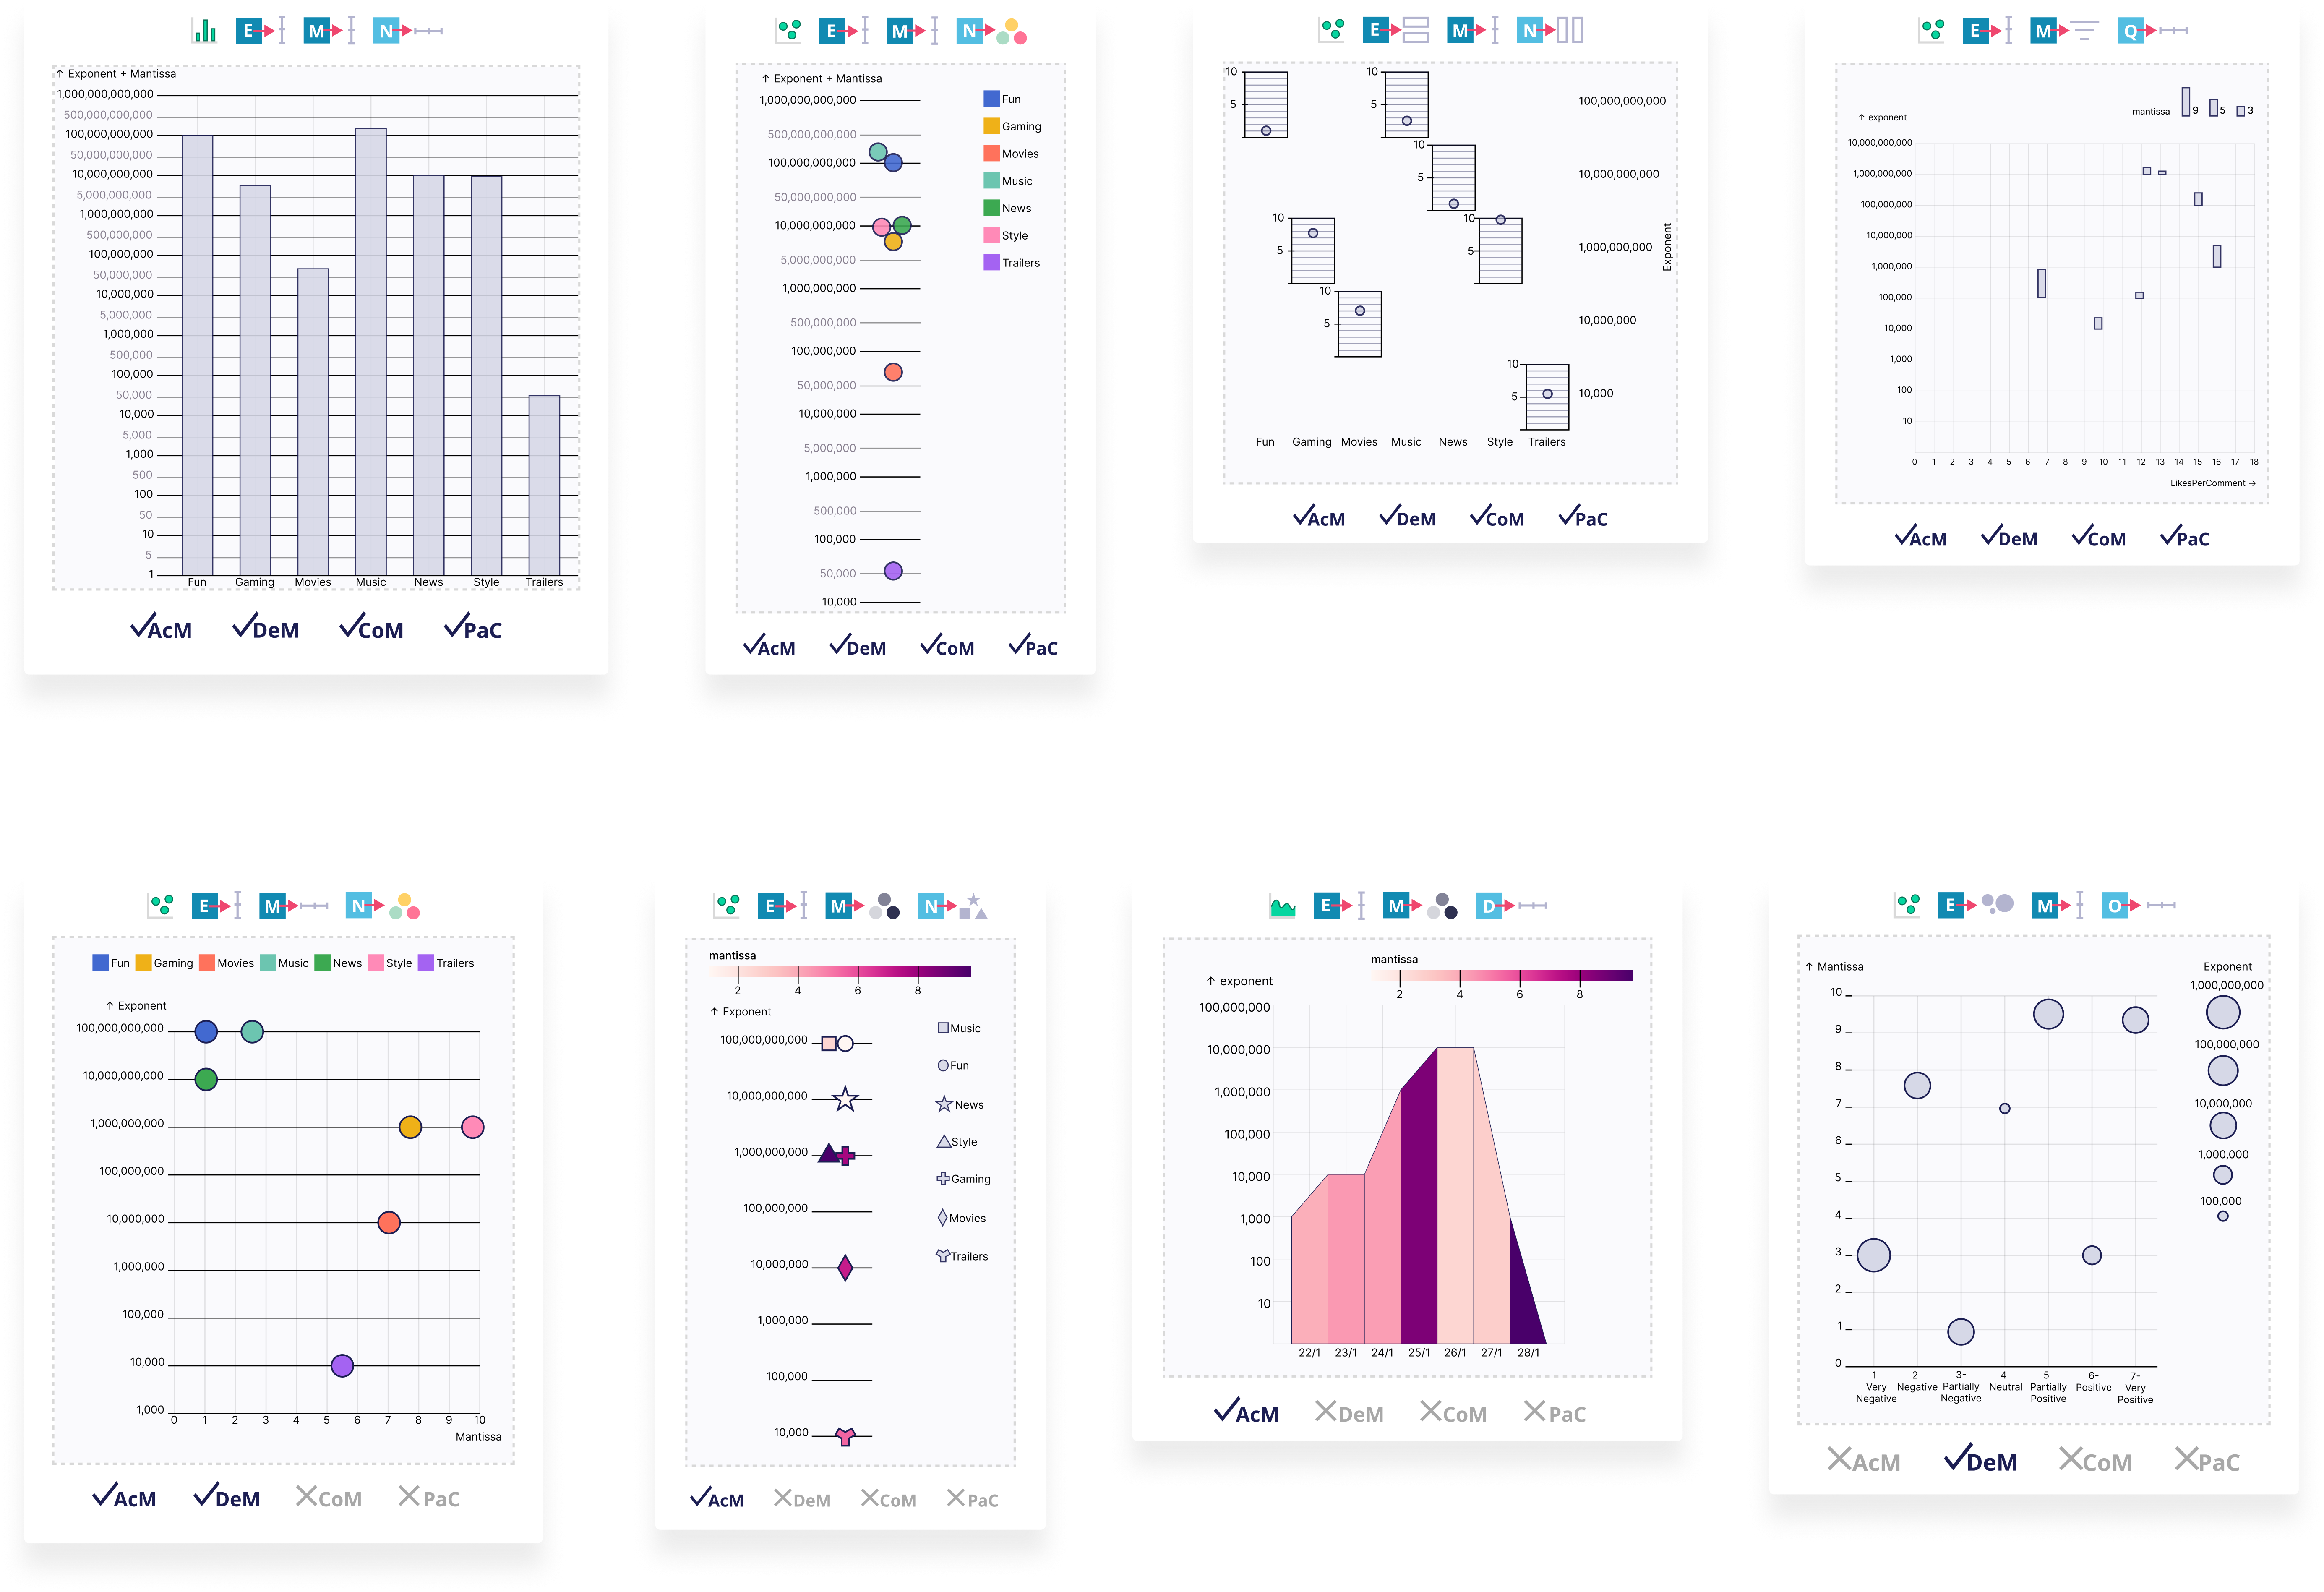
Examples of Visualizations in our Design Space
The 168 visualizations used in our evaluation are available at https://www.omvs-designspace.com/ and in the supplemental material
Reference
The full paper is available in hal.
Study materials
All supplemental materials are available on osf.io, released under a CC BY 4.0 license.
Contacts
Katerina Batziakoudi: kbatziakoudi@gmail.com
Florent Cabric: florent.cabric@inria.fr
Stéphanie Rey: Stephanie.REY@berger-levrault.com
Jean-Daniel Fekete: Jean-Daniel.Fekete@inria.fr