Visualization Literacy
Researchers
- Jeremy Boy
- Ronald A. Rensink
- Enrico Bertini
- Jean-Daniel Fekete
Summary
We developed a method for assessing the visualization literacy (VL) of a user, based on Item Response Theory. Assessing how well people understand visualizations has great value for research (e. g., to avoid confounds), for design (e. g., to best determine the capabilities of an audience), for teaching (e. g., to assess the level of new students), and for recruiting (e. g., to assess the level of interviewees). Our work consisted in designing and evaluating two VL tests for line graphs, and in extending our method to bar charts and scatterplots. We then optimized these tests, and made them readily available for fast, effective, and scalable web-based use.
Pictures
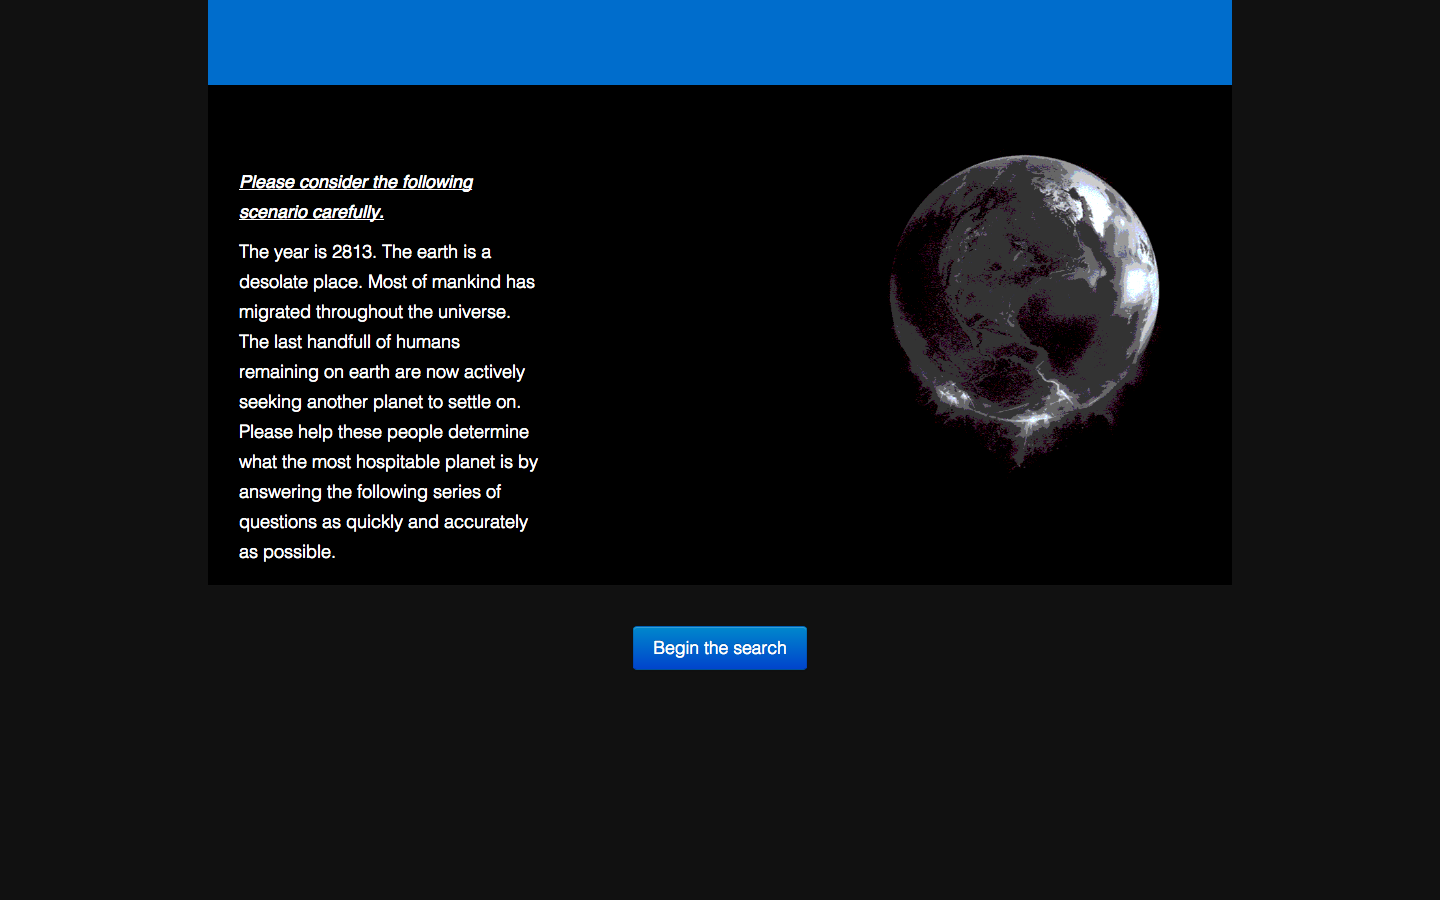
To make sure participants cannot rely on prior knowledge of the data, each test uses the scenario above
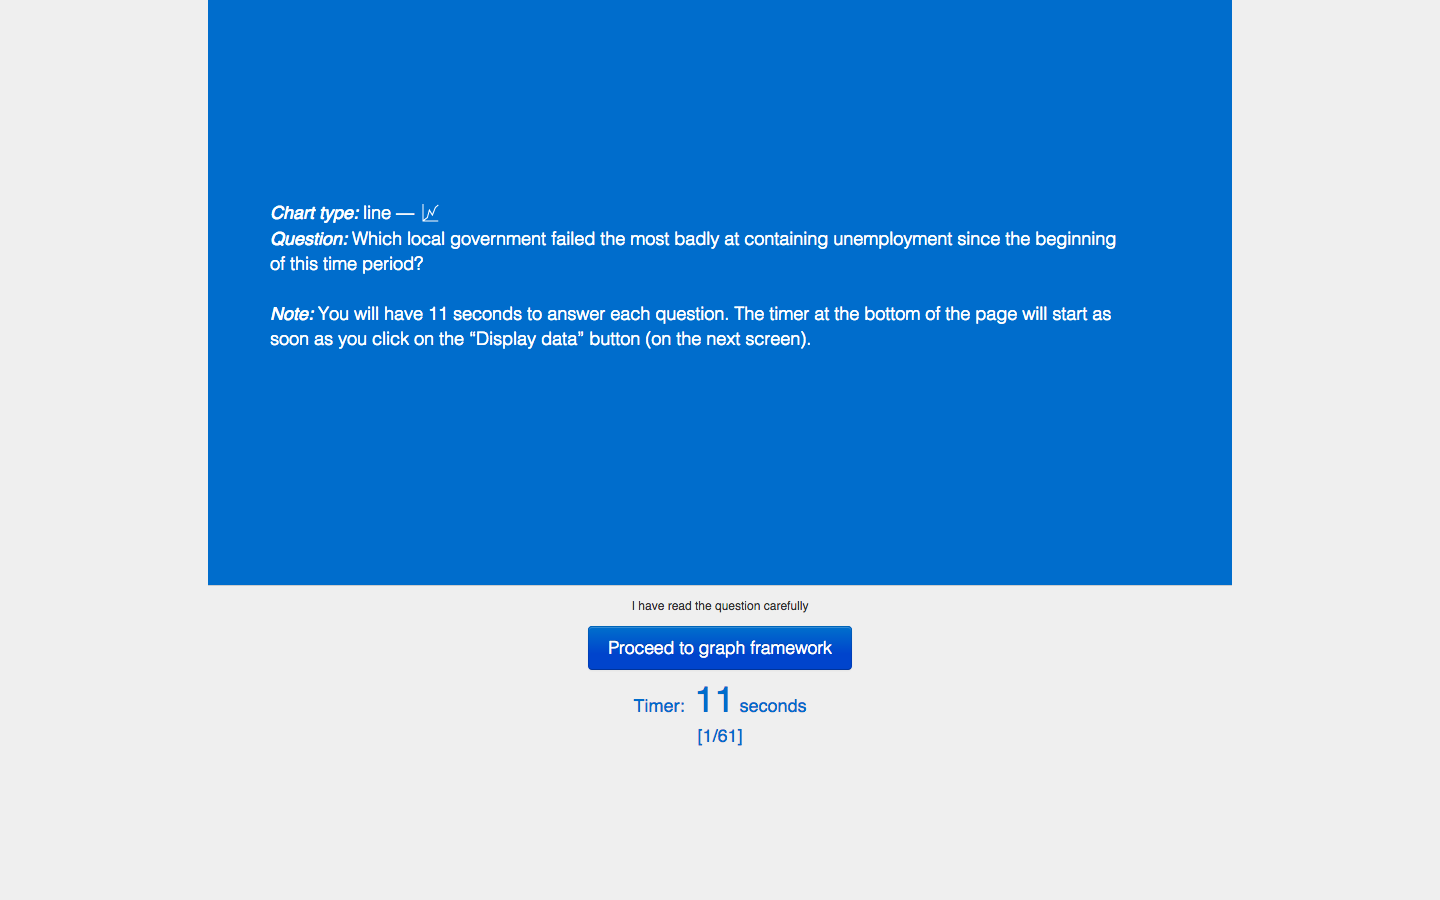
Questions in the tests are repeated six times. Before each block, participants are primed with the question and the upcoming type of chart they will need to analyze.
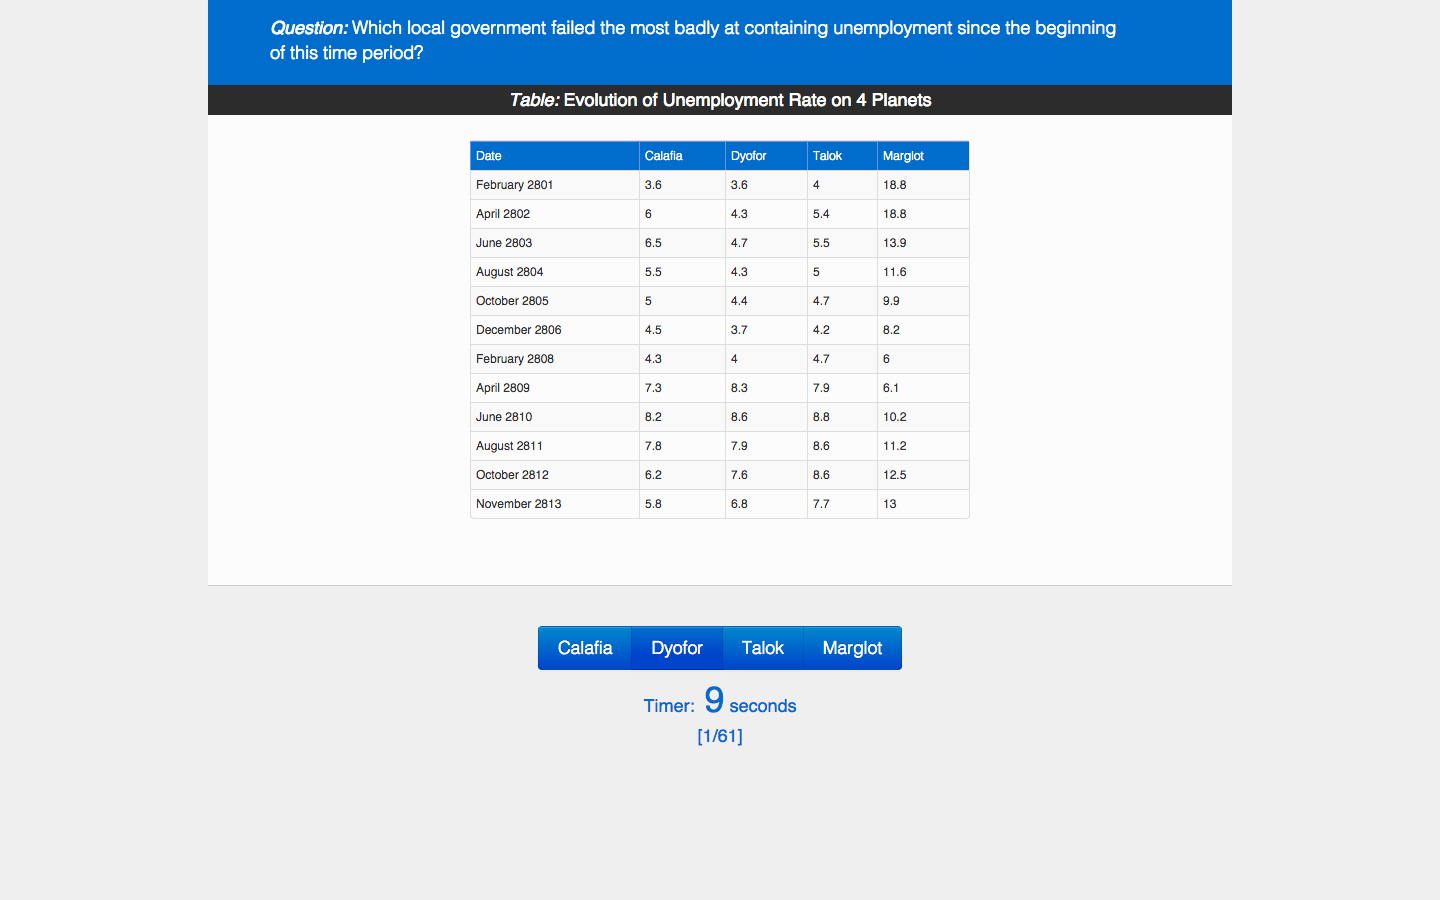
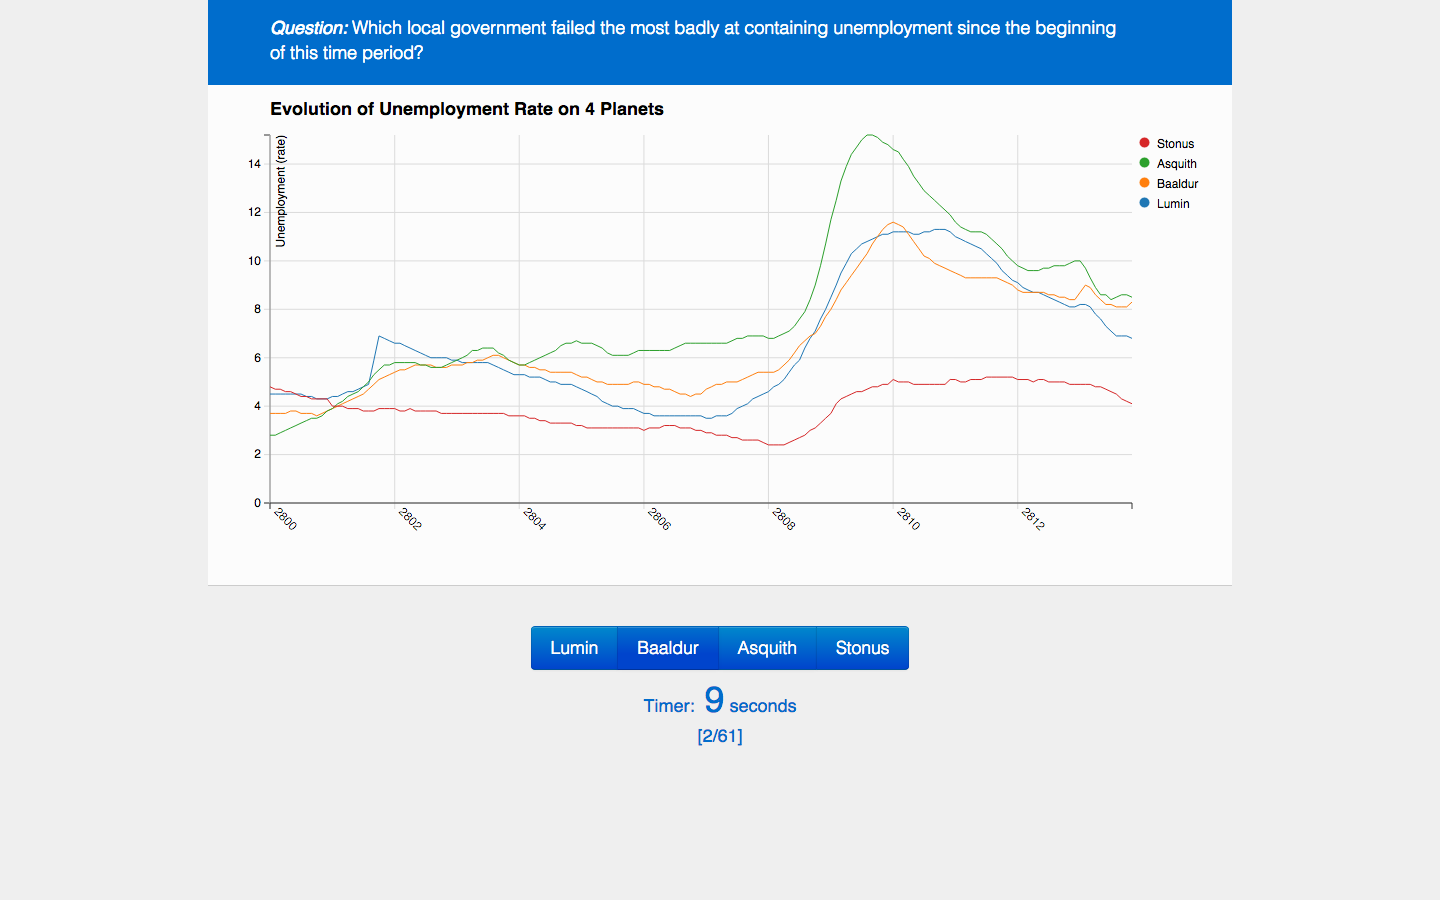
The six repetitions consist of a table condition and five graphical conditions (in this case, a line graph).