INRIA/AVIZ Open House
Please check this web page close to the event date as some details may change.
On Saturday 15th Novembre from 11.30AM to 4.30PM Aviz will be organizing a visit to give Vis 2014 attendees the opportunity to take a quick look at Aviz's current research on interactive information visualization.
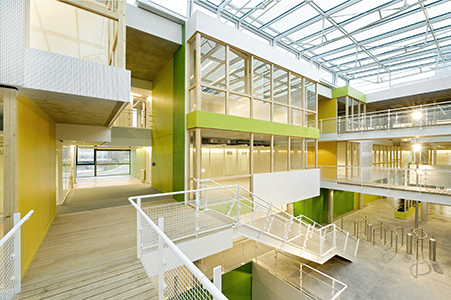
Aviz (as well as other HCI teams such as in situ and Limsi) is located at the Plateau de Saclay, at about 25km from Paris.
Registration
To participate you need to register by Friday 14th Novembre 12PM. If you're not registered the caretaker of our lab may not let you in . Please sign up as soon as you can so we get an idea of the number of visitors (we may limit the number of visitors).
To sign up follow the registration link here.
Organized Travel to Aviz
Getting to our lab by public transportation is a little bit complicated especially over the weekend, so we have arranged a shuttle bus service for you.
- Meeting Time: 9:30 AM
- Meeting place: Conference Venue Hotel lobby.
- The shuttle bus (in front of the hotel) will leave at 10:00 AM sharp. Try not to be late! In case you miss the bus, make sure you have also read the 'Coming by yourself' section below and printed the instructions page.
- Your travel helper is Lonni Besançon wearing a bright orange tie and will be waiting by the hotel lobby.
- The bus will leave Aviz at 4:30 PM arriving at the Marriot Rive-Gauche Hotel around 17:15.
Coming by Yourself
Public transportation on Saturday is not very reliable, so we strongly encourage you to take the shuttle bus as described in the 'Organized Travel to Aviz' section above unless you feel adventurous or have missed our helper.
- Follow our instructions on how to come here by public transportation. UPDATE: this page has been updated on Friday 7th Nov. If you already printed it, then you might want to print it again.
- Make sure you have already bought a two-way ticket for zones 1 to 5 (see detailed instructions here). In addition, you will need two regular metro tickets (also called t+) to take the bus (one to go to the lab, another one to come back). Note that the bus service on Saturday is very limited. If you take the RER, make sure you stop at RER station 'Le Guichet' and NOT 'Massy Palaiseau', then someone from Aviz could pick you up by car.
- In case of a problem or if you need a lift from the RER station 'Le Guichet' (10 mins car ride uphill), call <person TBD> at <cellphone number will be emailed to you the day before>.
Preliminary Program
- 10:00 - Bus leaves Marriott Rive-Gauche Hotel
- 10:45 - Bus arrives at Digiteo Building (Aviz)
- 11:00 - Welcome, Jean-Daniel Fekete
- 11.30 - Demos PART I
- 12:45 - Lunch
- 13:45 - Demos PART II
- 15:50 - Coffee break
- 16:30 - Bus leaves
List of Demos
Demos will take place in separate rooms as indicated below. The duration of each demo slot is also indicated below (25 minutes for most demos) including 5 minutes for questions and 5 minutes time to change rooms.
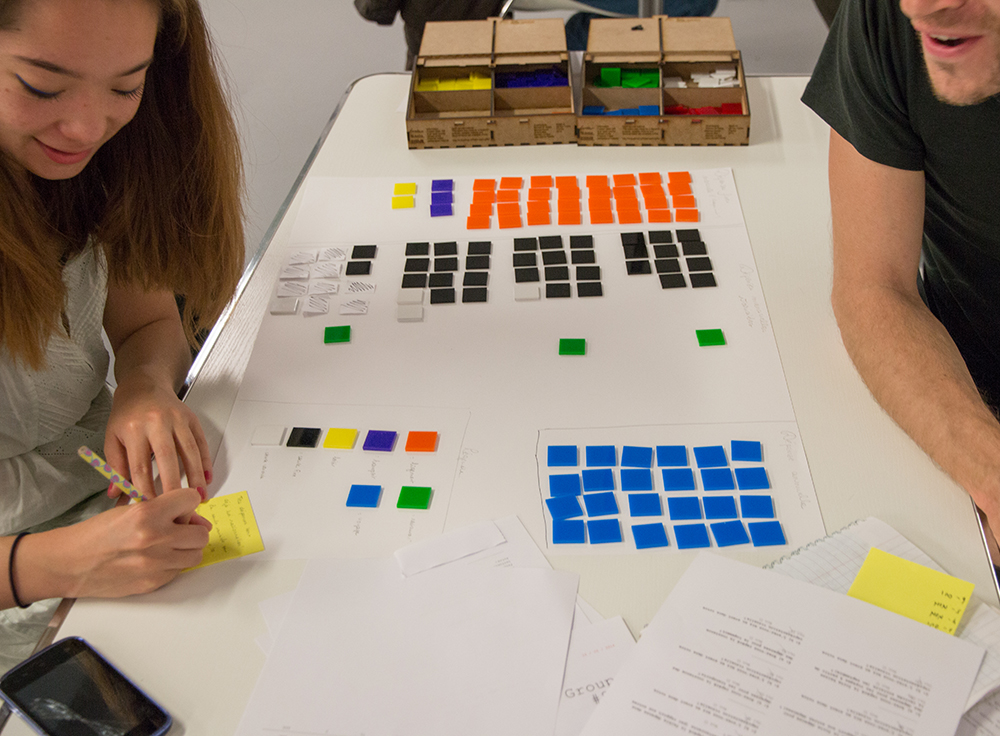 | A | meeting room, 1046 | Samuel Huron and Jeremy Boy | Constructive Visualization Activity 1 Understanding how data properties are mapped to visual attributes is essential for “reading” and authoring visualizations. While this may seem obvious to people in our community, it may not be for less experienced people. We invite you to take part in a collaborative pedagogic activity originally designed for information visualization novices, which consists in a hands-on exploration of visual mapping processes. This is done by manipulating and assembling visual marks—small plastic squares which name tokens—that each represent a quantitative value. The activity has three phases. First, you will be grouped in teams of two or three, and we will give each group a different dataset to consider. You will then collaborate with your teammates on making one or several visualizations using the provided dataset. Second, you will go see what other groups have designed and try to find insights into their data. Third, we will ask you to provide your thoughts on this activity. Duration: 50 minutes. |
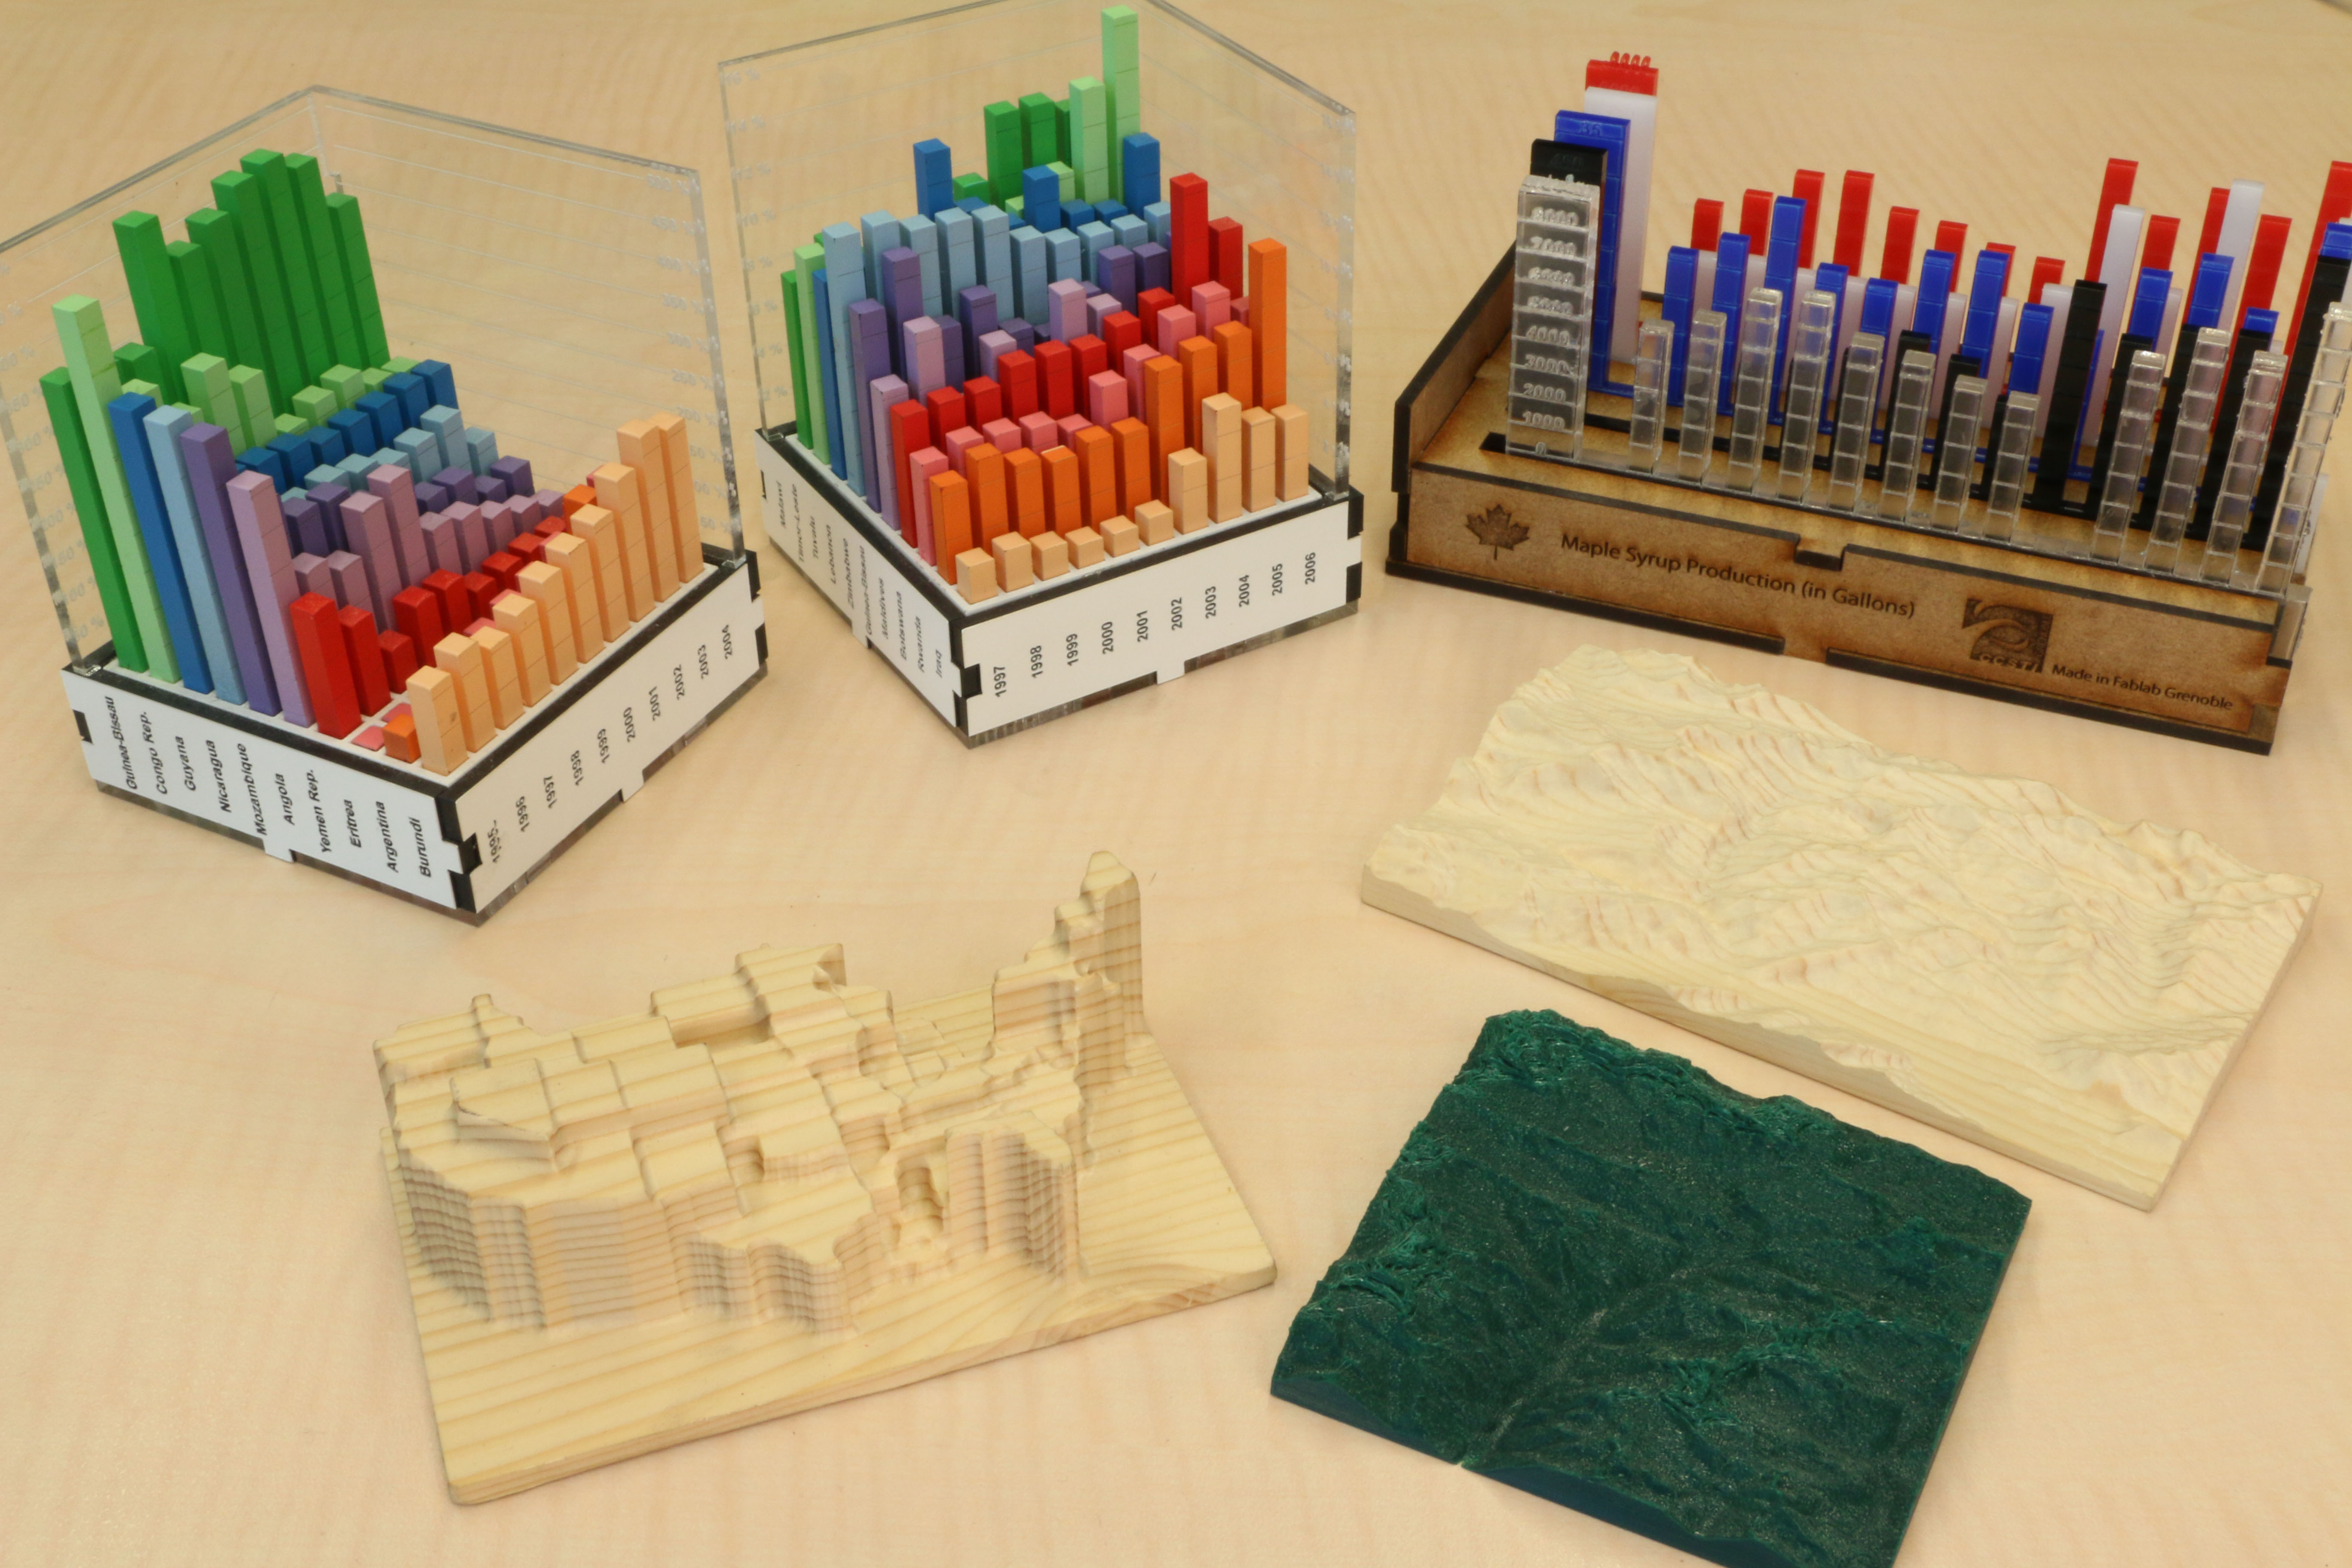 | B | Aviz Hall | Mathieu Le Goc and Yvonne Jansen | Physical Visualizations Physical visualizations map data to physical form instead of pixels or ink. This new visualization medium that has the potential to dramatically enrich and complement paper and computer displays. They became popular in the form of data sculptures, which are being created, exhibited and shared, from small data jewelry to large-scale museum installations. Aviz has been studying physical visualizations for their potential to support analytical tasks, besides their artistic and engaging aspects. We will showcase passive physical visualizations and present our current investigations of active. Duration: 25 minutes. |
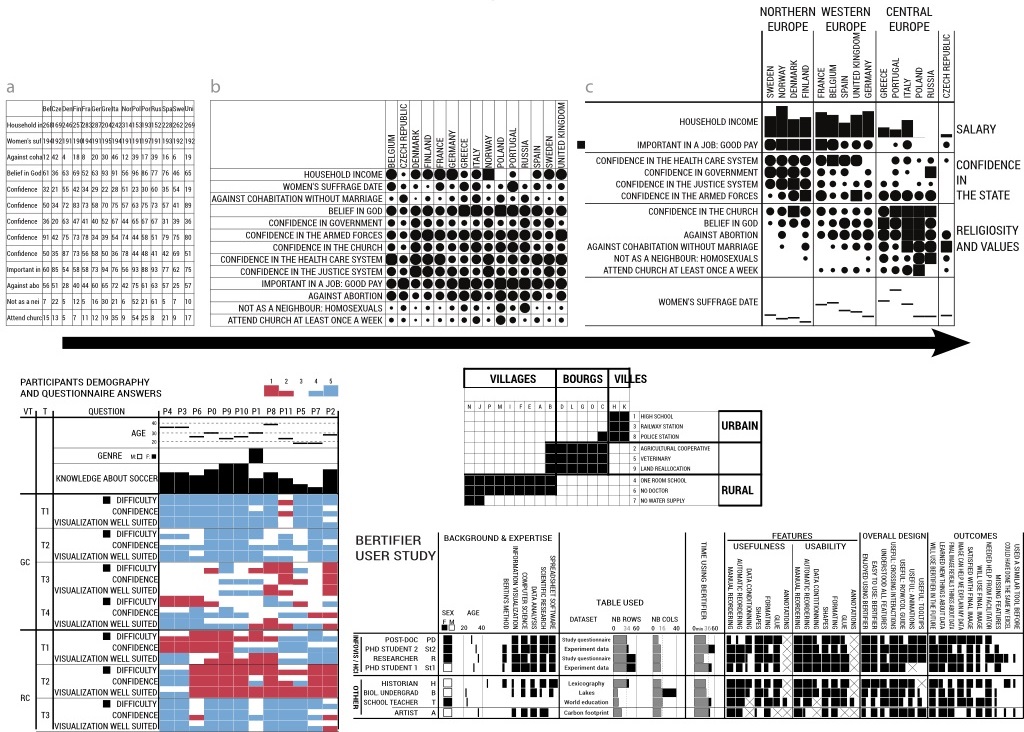 | C | studio 1, 1041 | Charles Perin | Bertifier We will present Bertifier, a Web app for rapidly creating tabular visualizations from spreadsheets. It directly draws from Jacques Bertin’s matrix analysis method, whose goal was to "simplify without destroying" by encoding cell values visually and grouping similar rows and columns. Bertifier has the potential to bring Bertin's method to a wide audience of both technical and non-technical users, and empower them with data analysis and communication tools that were so far only accessible to a handful of specialists. Duration: 25 minutes. |
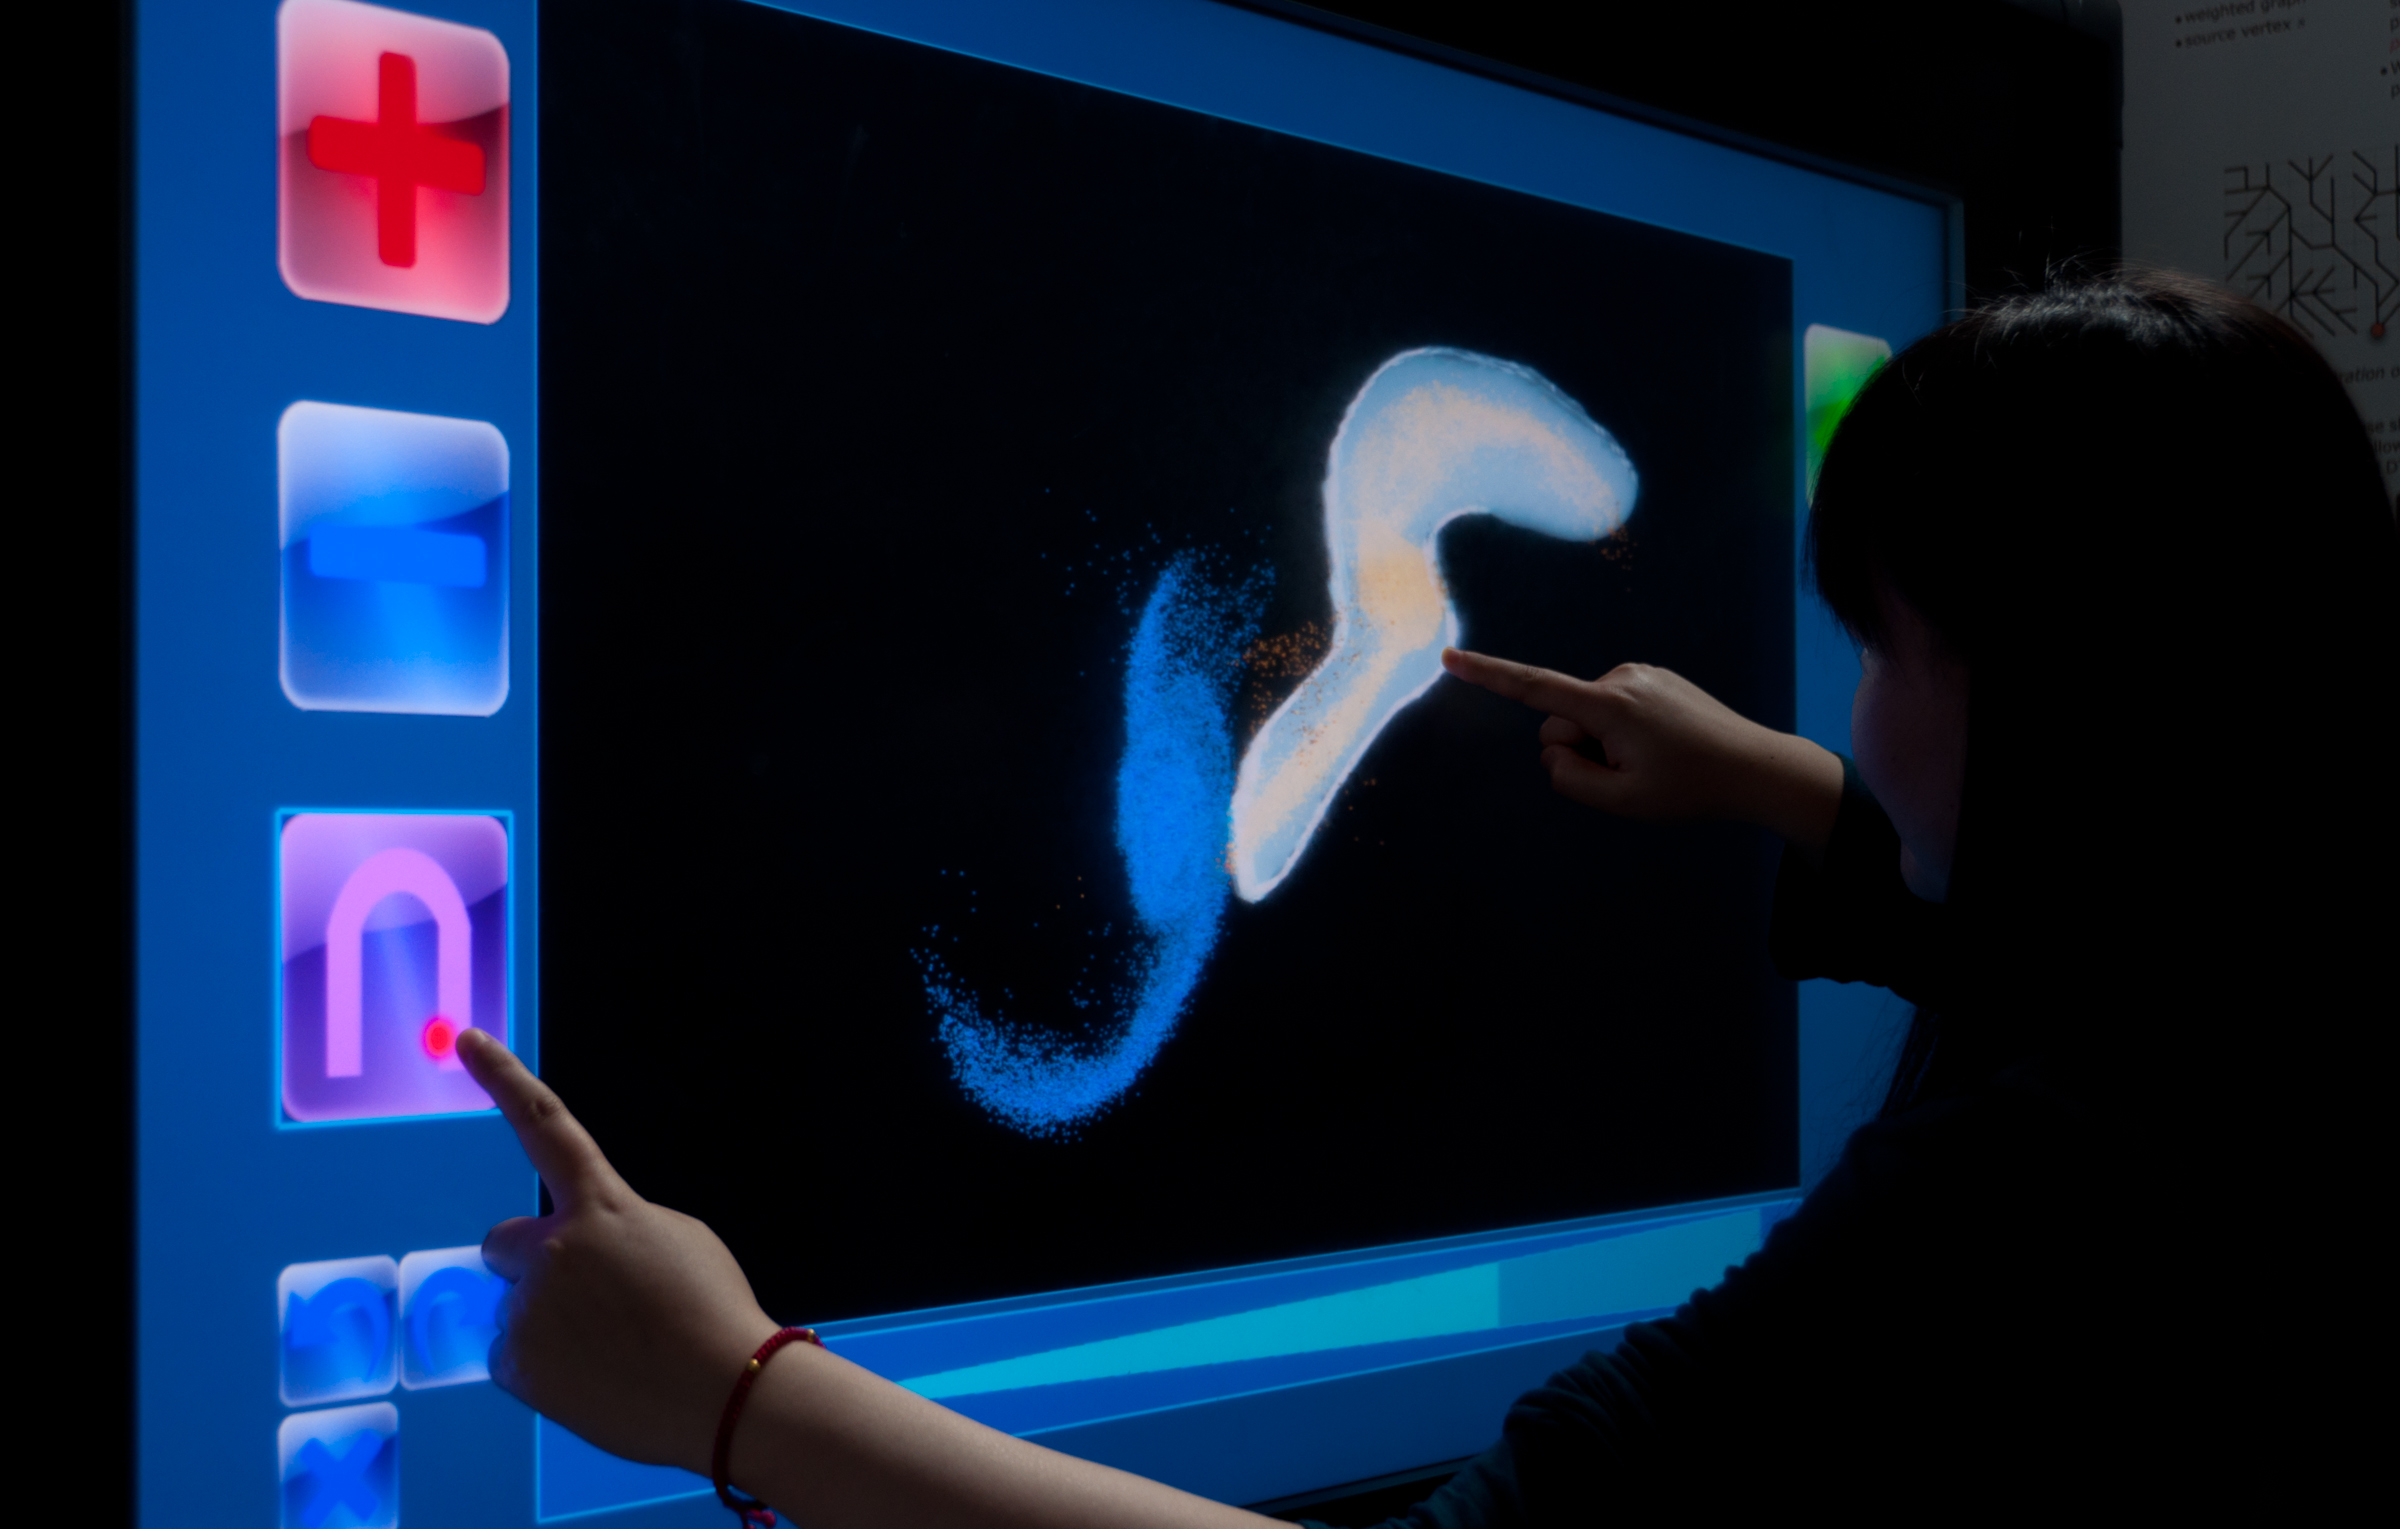 | D | demo room, 1040 | Tobias Isenberg | Touch Interaction with 3D Data We will present FI3D, a technique to navigate in 3D datasets and control 7 degrees of freedom with only one or two fingers being used simultaneously. Also, we will present CloudLasso, a technique to spatially select parts of 3D datasets such as particles or volumes. Finally, we will present a case study in which we integrated several different interaction techniques into a tool for fluid mechanics experts to explore their data. Duration: 25 minutes. |
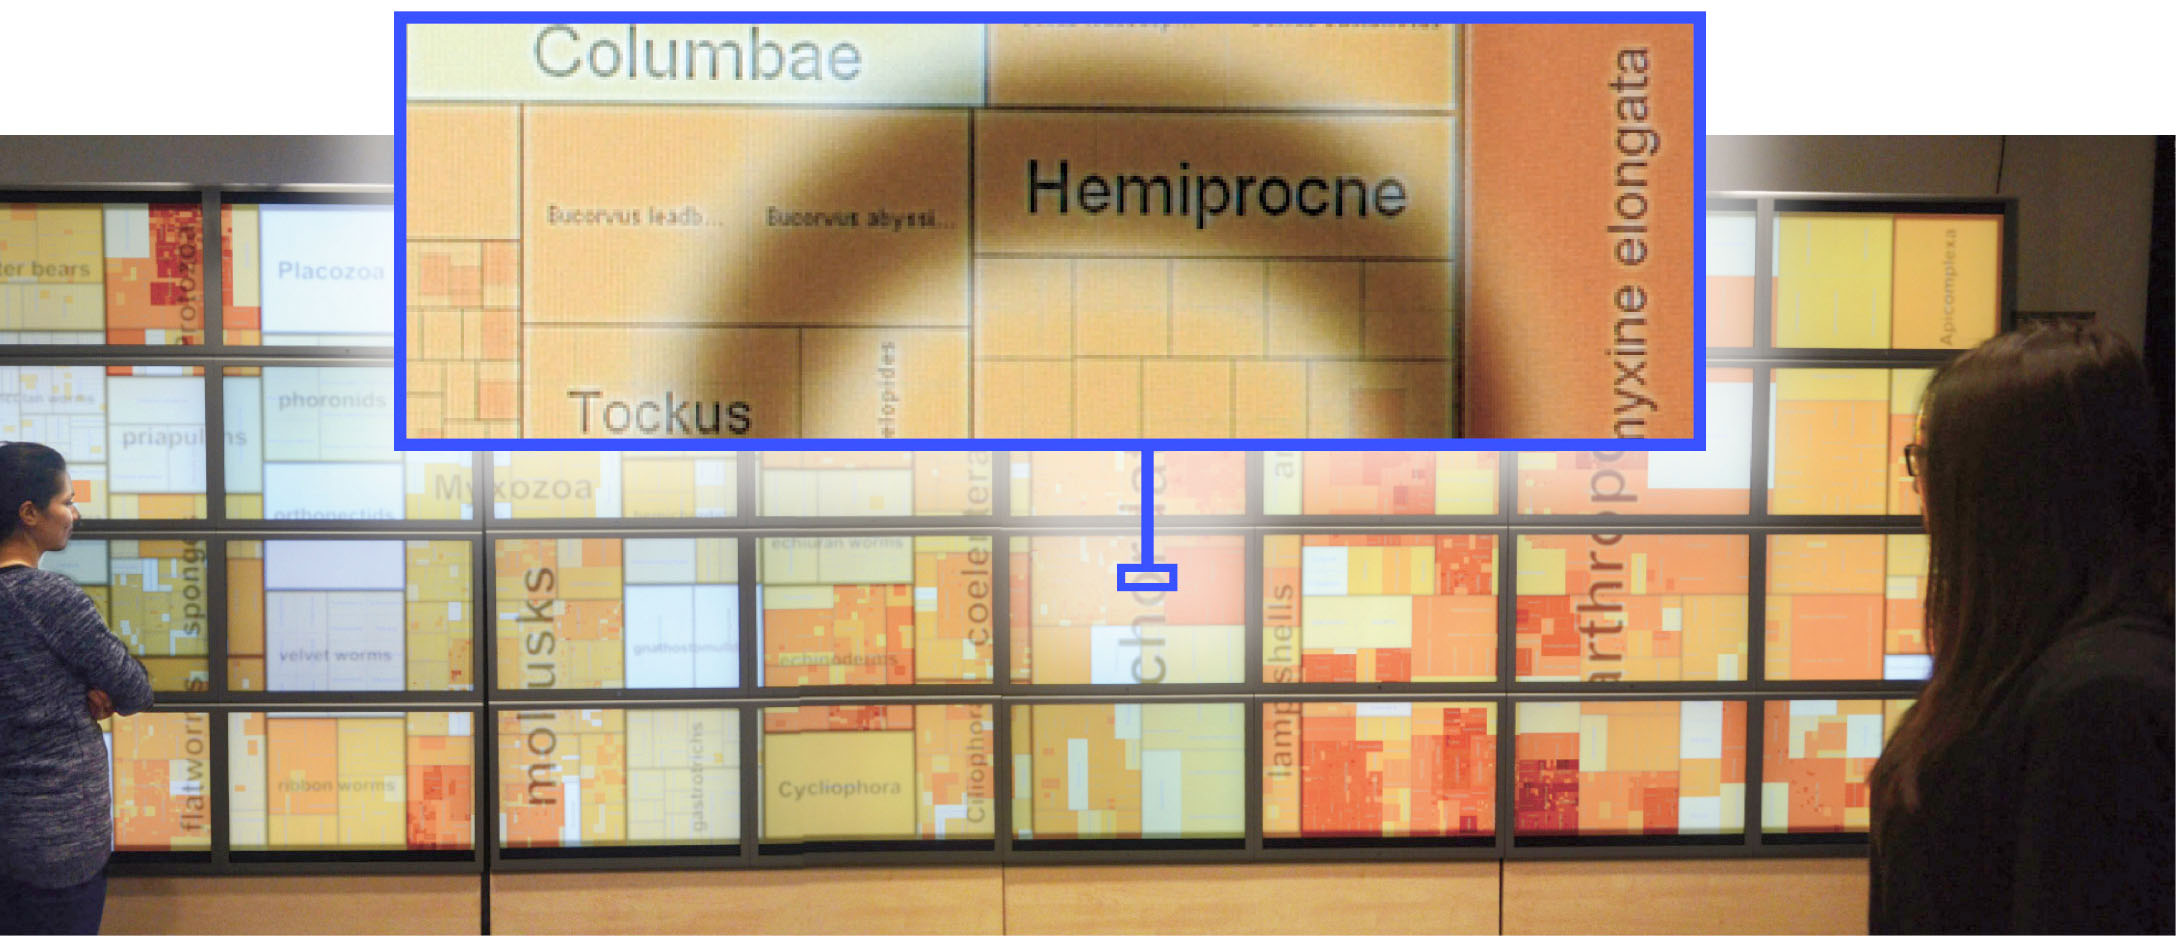 | E | WILDER, 1038 | Pierre Dragicevic | Hybrid images We present hybrid-image visualizations for large-scale viewing environments. Hybrid-image visualizations blend two different visual representations into a single static view, such that each representation can be perceived at a different viewing distance. They can be used, in particular, to enhance overview tasks from a distance and detail-in-context tasks when standing close to the display. By taking advantage of humans’ perceptual capabilities, they do not require tracking of viewers in front of a display. Duration: 15 minutes. |
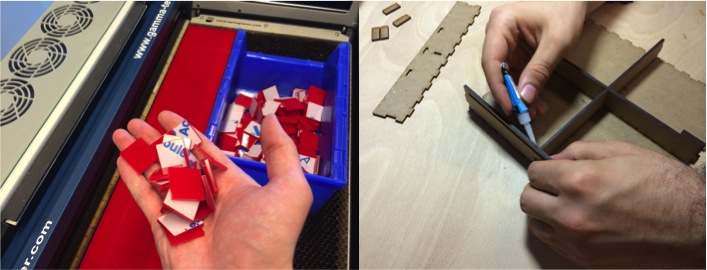 | F | Fablab, 1036 | Romain di Vozzo | Digital Fabrication for Physical Data Visualization (FAB)LAB DIGISCOPE is a digital fabrication laboratory created for the researchers of the Digiscope Project. Our fablab is equipped with rapid prototyping machines to create new hardware that supports research in Human- Computer Interaction and Data Visualization. Duration: 25 minutes. |
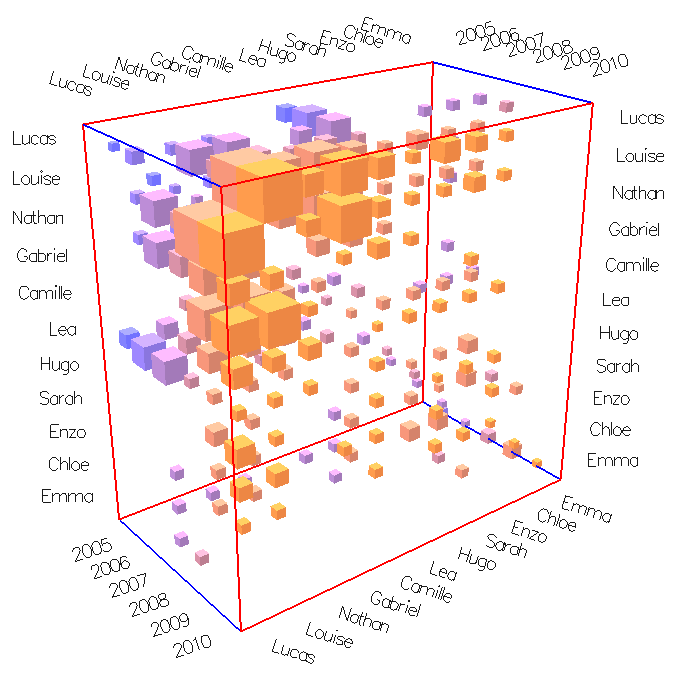 | G | studio 2, 1035 | Benjamin Bach | Visualizing Dynamic Networks with Matrix Cubes This demo will present how dynamic networks (networks changing over time) can be interactively explored and visualized based on the metaphor of a space-time cube. Duration: 25 minutes. |
Tour guides
- Evanthia Dimara
- Lonni Besançon
- Nadia Boukhelifa
- Jean-Daniel Fekete
- Bongshin Lee
- Alix Goguey
- Fanny Chevalier
Checklist
- Register to the event by Friday 14th Novembre 12PM
- Print the instructions on how to come to Aviz and buy your travel tickets if you are taking public transportation
Organizers
- Petra Isenberg - petra.isenberg@inria.fr
- Pierre Dragicevic - pierre.dragicevic@inria.fr
- Nadia Boukhelifa - nadia.boukhelifa@inria.fr