Micro visualizations for pervasive and mobile data exploration

Project Details:
| Project Code: | ANR-18-CE92-0059-01 |
| Program: | PRCI 2018 |
| Duration: | 01/11/2018-2/28/2023 |
| Researchers: | Petra Isenberg (PI Inria), Thomas Ertl (PI Stuttgart), Tanja Blascheck (PostDoc Stuttgart), Alaul Islam (PhD Inria), Fairouz Grioui (PhD Stuttgart), Ranjini Aravind, Tingying He, Yuanyang Zhong (Master Interns) |
| Research Themes: | Information Visualization, Visual Analytics, Human-Computer Interaction |
Project Summary
The goal of this joint Franco-German project is to study very small data visualizations, micro visualizations, in display contexts that can only dedicate minimal rendering space for data representations. We will study human perception of and interaction with micro visualizations given small as well as complex data. The increasing demand for data visualizations on small mobile devices such as fitness tracking armbands, smart watches, or mobile phones drives our research. Given this usage context, we focus on situations in which visualizations are used “on the go,” while walking, riding a vehicle, or running. It is still unclear to which extent our knowledge of desktop-sized visualizations transfers to contexts that involve minimal display space, diverse viewing angles, and moving displays. While the last years have shown an increasing research interest in visualization for display walls, tables, tablets, or to a lesser extent mobile phones, our focus on small or moving displays is novel and timely while supporting realistic usage scenarios. Ultimately, our research aims to empower people to use visualizations outside a typical work environment furthering the research agenda of “beyond-the-desktop” visualizations. Example usage scenarios include fitness tracking armbands showing step counts or heart rates, hand-held GPS trackers showing elevation profiles, or mobile phone visualizations used in emergency response scenarios. This proposal builds on and expands two existing research streams: data glyphs, which focus on studying data representations of multi-attribute dimensions, and word-scale visualizations such as sparklines, which focus on small visualizations embedded in text-documents. In this project, we consider these types of small visualizations together under the umbrella of “micro visualizations.” Specifically, we define micro visualizations as small-scale visualizations that lack or have a limited set of reference structures such as labels, data axes, or grid lines and have a small physical footprint of a few square centimeters. Micro visualizations can be as simple as small unit-based visualizations such as a battery indicator but also include multi-dimensional visualizations such as star glyphs, small geographic visualizations or even small network visualizations. Although micro visualizations are essential to mobile visualization contexts, we know surprisingly little about their general visual and interaction design space or people’s ability in interpreting micro visualizations. We will address this gap by proposing a common framework, conducting empirical studies to understand people’s abilities to interpret these visualizations while in motion, and by developing a software toolkit to aid practitioners in developing micro visualizations for emerging mobile and wearable displays. In summary, we aim at paving the way for a pervasive use of visualizations and thus a better and broader understanding of the complex world around us.
Results
Images
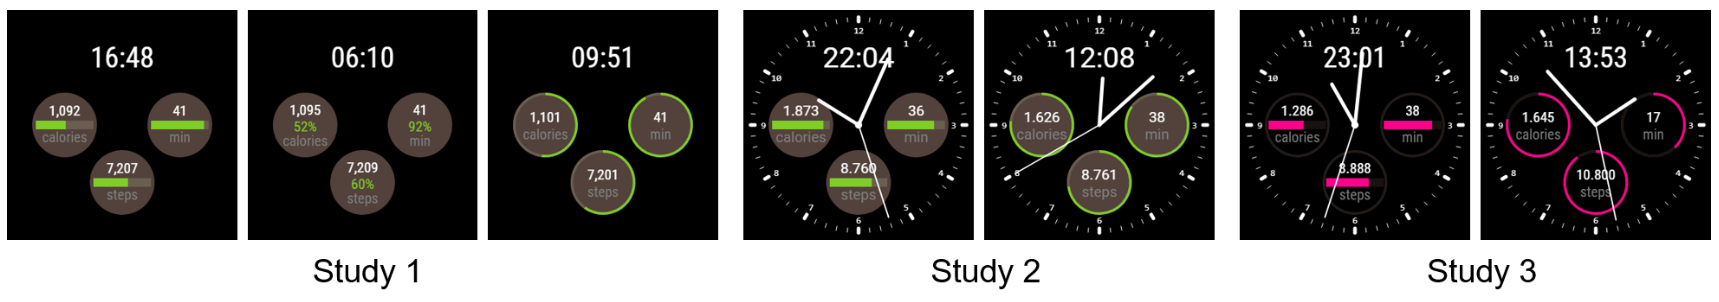
An overview of different smartwatch faces we tested in our 2023 PacificVis paper
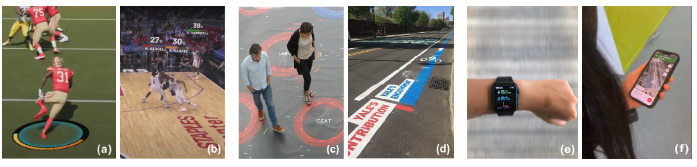
An overview of different scenarios in which visualizations will be read while moving. From our 2022 CHI workshop.
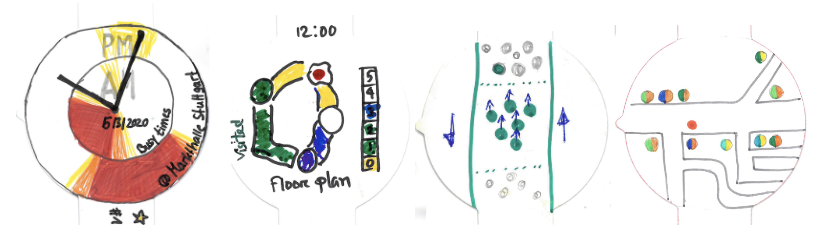
Examples of contextual designs of new smartwatch interfaces we collected during an ideation exercise - reported about in our EuroVis 22 poster and the Ideation bookchapter.
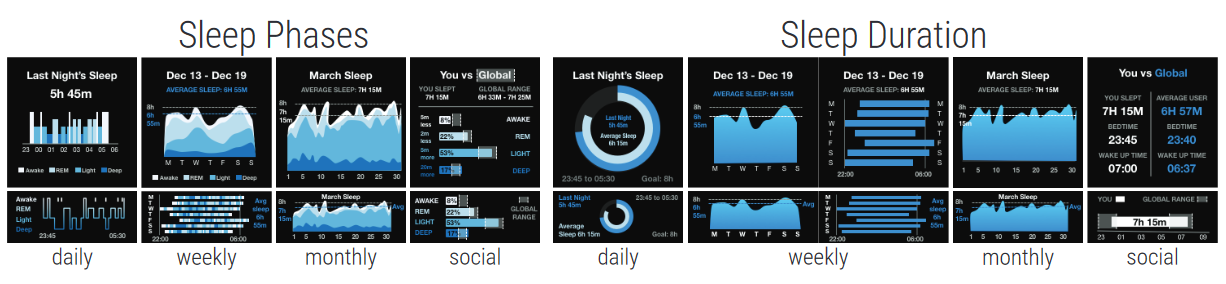
Sleep visualizations for fitness bands and smartwatches that participants rated highly for different types of sleep data. From our CHI 2022 paper.
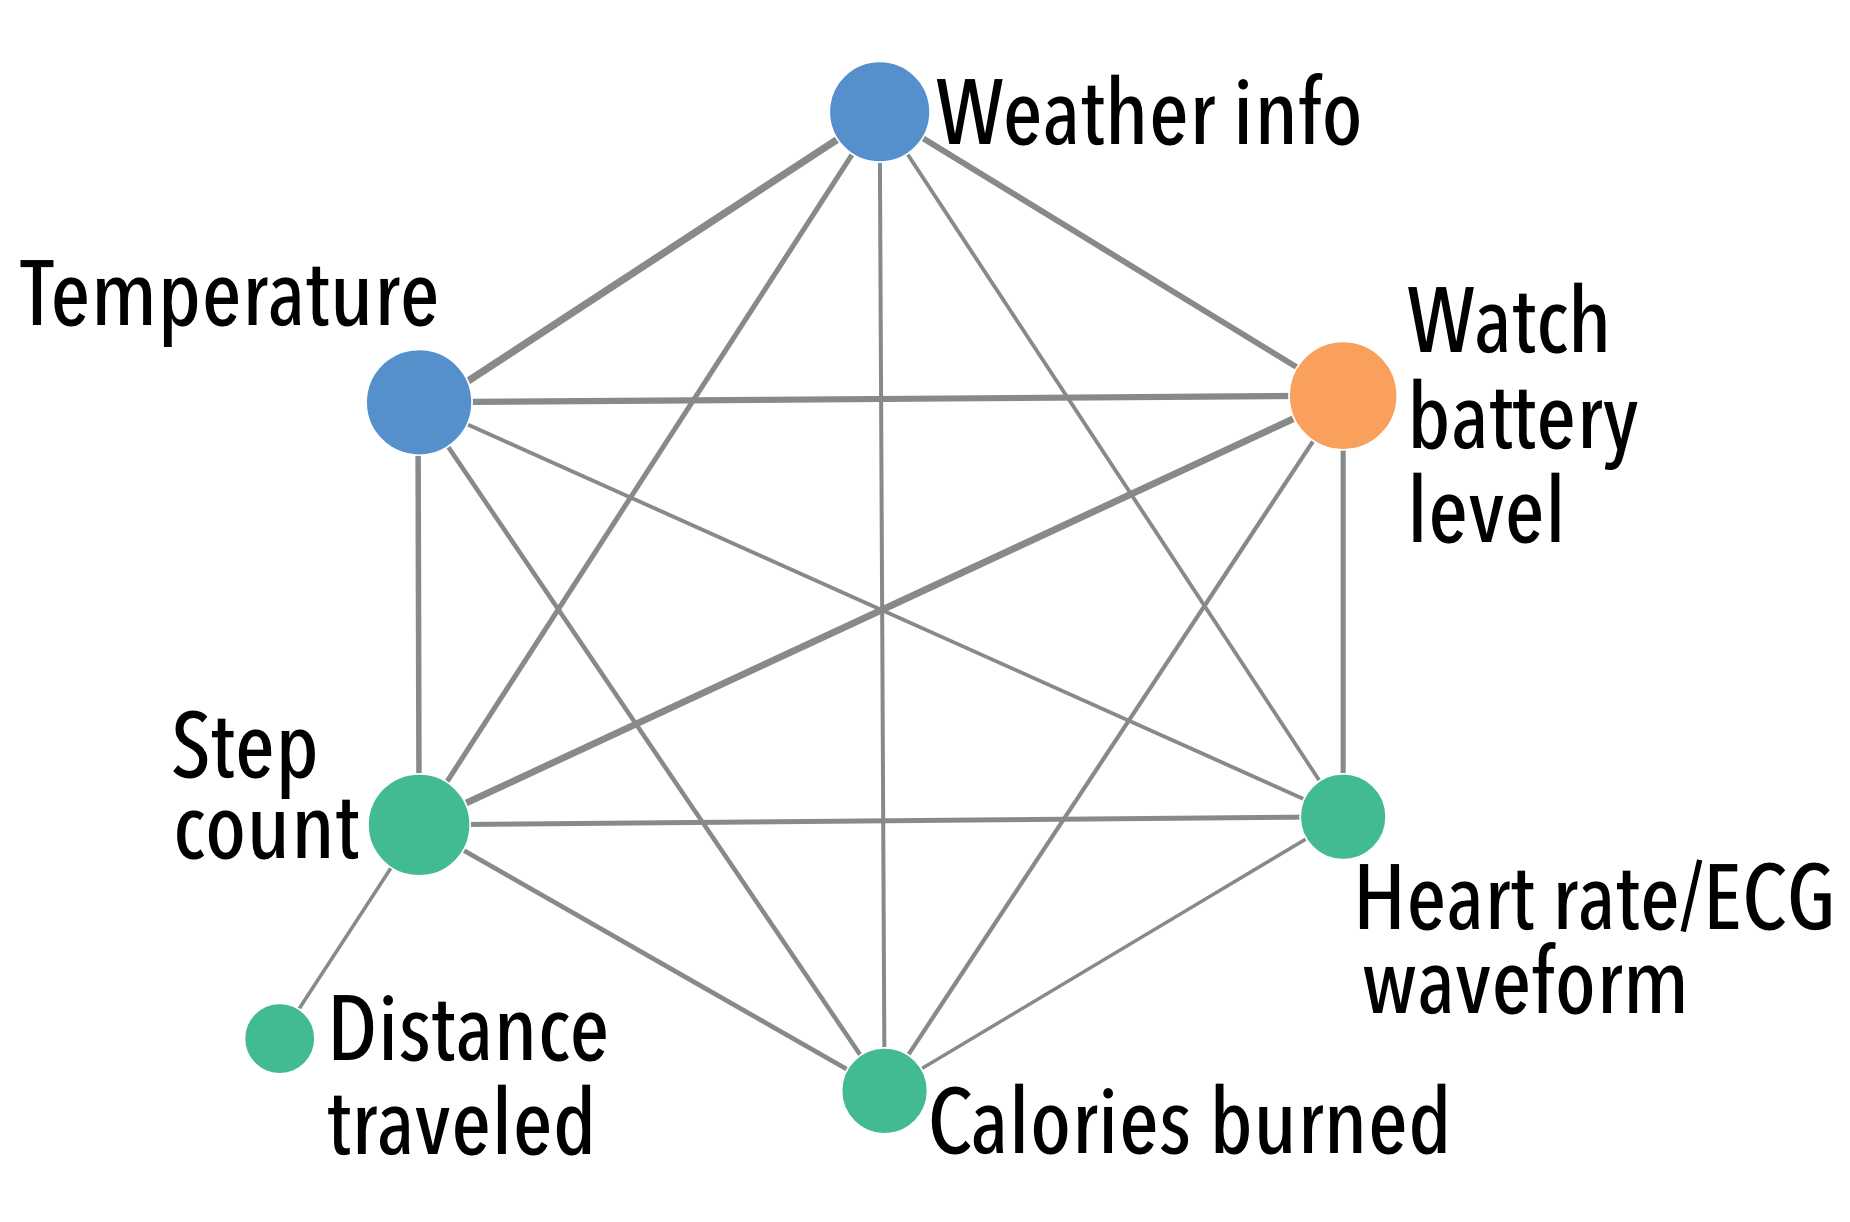
Common types of data people visualize on their watchfaces. From our 2020 VIS Shortpaper.
Joint Scientific Publications
Conference Publications
- Tanja Blascheck, Lonni Besançon, Anastasia Bezerianos, Bongshin Lee, Alaul Islam, Tingying He, Petra Isenberg. 2023. Studies of Part-to-Whole Glanceable Visualizations on Smartwatch Faces. The IEEE Pacific Visualization Symposium (PacificVis), 10.1109/PacificVis56936.2023.00028.
- Alaul Islam, Ranjini Aravind, Tanja Blascheck, Anastasia Bezerianos, Petra Isenberg. 2022. Preferences and Effectiveness of Sleep Data Visualizations for Smartwatches and Fitness Bands. Conference on Human Factors in Computing Systems (CHI), 10.1145/3491102.3501921.
- Tanja Blascheck, Petra Isenberg. 2021. A Replication Study on Glanceable Visualizations: Comparing Different Stimulus Sizes on a Laptop Computer. International Conference on Computer Vision, Imaging and Computer Graphics Theory and Applications (IVAP), pp.133-143, 10.5220/0010328501330143.
- Alaul Islam, Anastasia Bezerianos, Bongshin Lee, Tanja Blascheck, Petra Isenberg. 2020. Visualizing Information on Watch Faces: A Survey with Smartwatch Users. IEEE Visualization Conference Short Papers, 10.1109/VIS47514.2020.00038.
Books/Book Chapters
- Tanja Blascheck, Frank Bentley, Eun Kyoung Choe, Tom Horak, and Petra Isenberg. 2021. Characterizing glanceable visualizations: From perception to behavior change. In Mobile Data Visualization, pages 151–176. Chapman and Hall/CRC. 10.1201/9781003090823-5
- Sheelagh Carpendale, Petra Isenberg, Charles Perin, Tanja Blascheck, Foroozan Daneshzand, Alaul Islam, Katherine Currier, Peter Buk, Victor Cheung, Lien Quach, and Laton Vermette. 2021. Mobile visualization design: An ideation method to try. In Mobile Data Visualization, pages 241–261. Chapman and Hall/CRC. 10.1201/9781003090823-8
Others
- Alaul Islam, Lijie Yao, Anastasia Bezerianos, Tanja Blascheck, Tingying He, Bongshin Lee, Romain Vuillemot, Petra Isenberg. 2022. Reflections on Visualization in Motion for Fitness Trackers. MobileHCI 2022 Workshop on New Trends in HCI and Sports, Vancouver, Canada.
- Alaul Islam, Tanja Blascheck, Petra Isenberg. 2022. Context Specific Visualizations on Smartwatches. Posters of the European Conference on Visualization (EuroVis), 10.2312/evp.20221122.
- Franziska Huth, Miriam Awad-Mohammed, Johannes Knittel, Tanja Blascheck, and Petra Isenberg, 2021. Online Study of Word-Sized Visualizations in Social Media, Posters of the European Conference on Visualization (EuroVis) 10.2312/evp.20211069
Additional Publications at Inria
Theses
- Alaul Islam. 2023. Visualizations for Smartwatches and Fitness Trackers. PhD thesis. Université Paris-Saclay.
- Petra Isenberg. 2021. Micro Visualizations: Design and Analysis of Visualizations for Small Display Spaces. Habilitation (HDR) Thesis. Université Paris-Saclay.
- Yuanyang Zhong 2020. Studying black and white textures for visualization on e-ink displays. Master Thesis University of Twente
- Tingying He. 2021. Design Considerations for Data Visualization on Smartwatch Faces. Master Thesis Université Paris-Saclay. Master 2 in Computer Science - Human-Computer interaction. Externally funded.
- Ranjini Aravind. 2019. Understanding Micro Visualizations for Fitness Trackers. Master Thesis University of Paris-Sud, Master 2 in Computer Science - Interaction Specialty. Externally funded.
Book/Book Chapter
- Ricardo Langner, Lonni Besançon, Christopher Collins, Tim Dwyer, Petra Isenberg, Tobias Isenberg, Bongshin Lee, Charles Perin, and Christian Tominski. 2021. An introduction to mobile data visualization. In Mobile Data Visualization, pages 1–32. Chapman and Hall/CRC.
- Bongshin Lee, Raimund Dachselt, Petra Isenberg, and Eun Kyoung Choe. Mobile Data Visualization. Chapman and Hall/CRC, December 2021.10.1201/9781003090823
Additional Publications at Stuttgart
Conference Papers
- Fairouz Griou and Tanja Blascheck. 2023. Heart Rate Visualizations on a Virtual Smartwatch to Monitor Physical Activity Intensity. In Proceedings of the Conference on Computer Vision, Imaging and Computer Graphics Theory and Applications (VISIGRAPP) - IVAPP, SciTePress, pp. 101-114. 10.5220/0011665500003417
- Moritz Knabben, Martin Baumann, Tanja Blascheck, Tom Ertl, and Steffen Koch. 2021. “Visualizing Temporal-Thematic Patterns in Text Collections,” in Vision, Modeling, and Visualization, The Eurographics Association, 2021, pp. 9–16. 10.2312/vmv.20211366
- Max Franke, Moritz Knabben, Julian Lang, Steffec Koch, and Tanja Blascheck, 2022; “A Comparative Study of Visualizations for Multiple Time Series,” in Conference on Computer Vision, Imaging and Computer Graphics Theory and Applications (IVAPP). SciTePress, pp. 103--112. 10.5220/0010761700003124
Other
- Fairouz Grioui and Tanja Blascheck. 2021. Study of Heart Rate Visualizations on a Virtual Smartwatch. In Proceedings of the Symposium on Virtual Reality Software and Technology (VRST). ACM, pp: 96:1-06:3. 10.1145/3489849.3489913
- Franziska Huth, Tanja Blascheck, Steffen Koch, and Tom Ertl, “Animated Transitions for Small-Scale Visualizations,” in 15th International Symposium on Visual Information Communication and Interaction, ACM, 2022, p. 8. 10.1145/3554944.3554945
Supplementary Material
- Preferences and Efectiveness of Sleep Data Visualizations for Smartwatches and Fitness Bands - You can download the raw data and analysis code from the sleep viz studies (IRB approved under ref. no CER-Paris-Saclay-2021-015).
- Visualizing Information on Watch Faces: A Survey with Smartwatch Users - You can download the raw data and analysis code from the survey (IRB approved under ref. no Paris-Saclay-2020-002 CER).