Selecting an Event
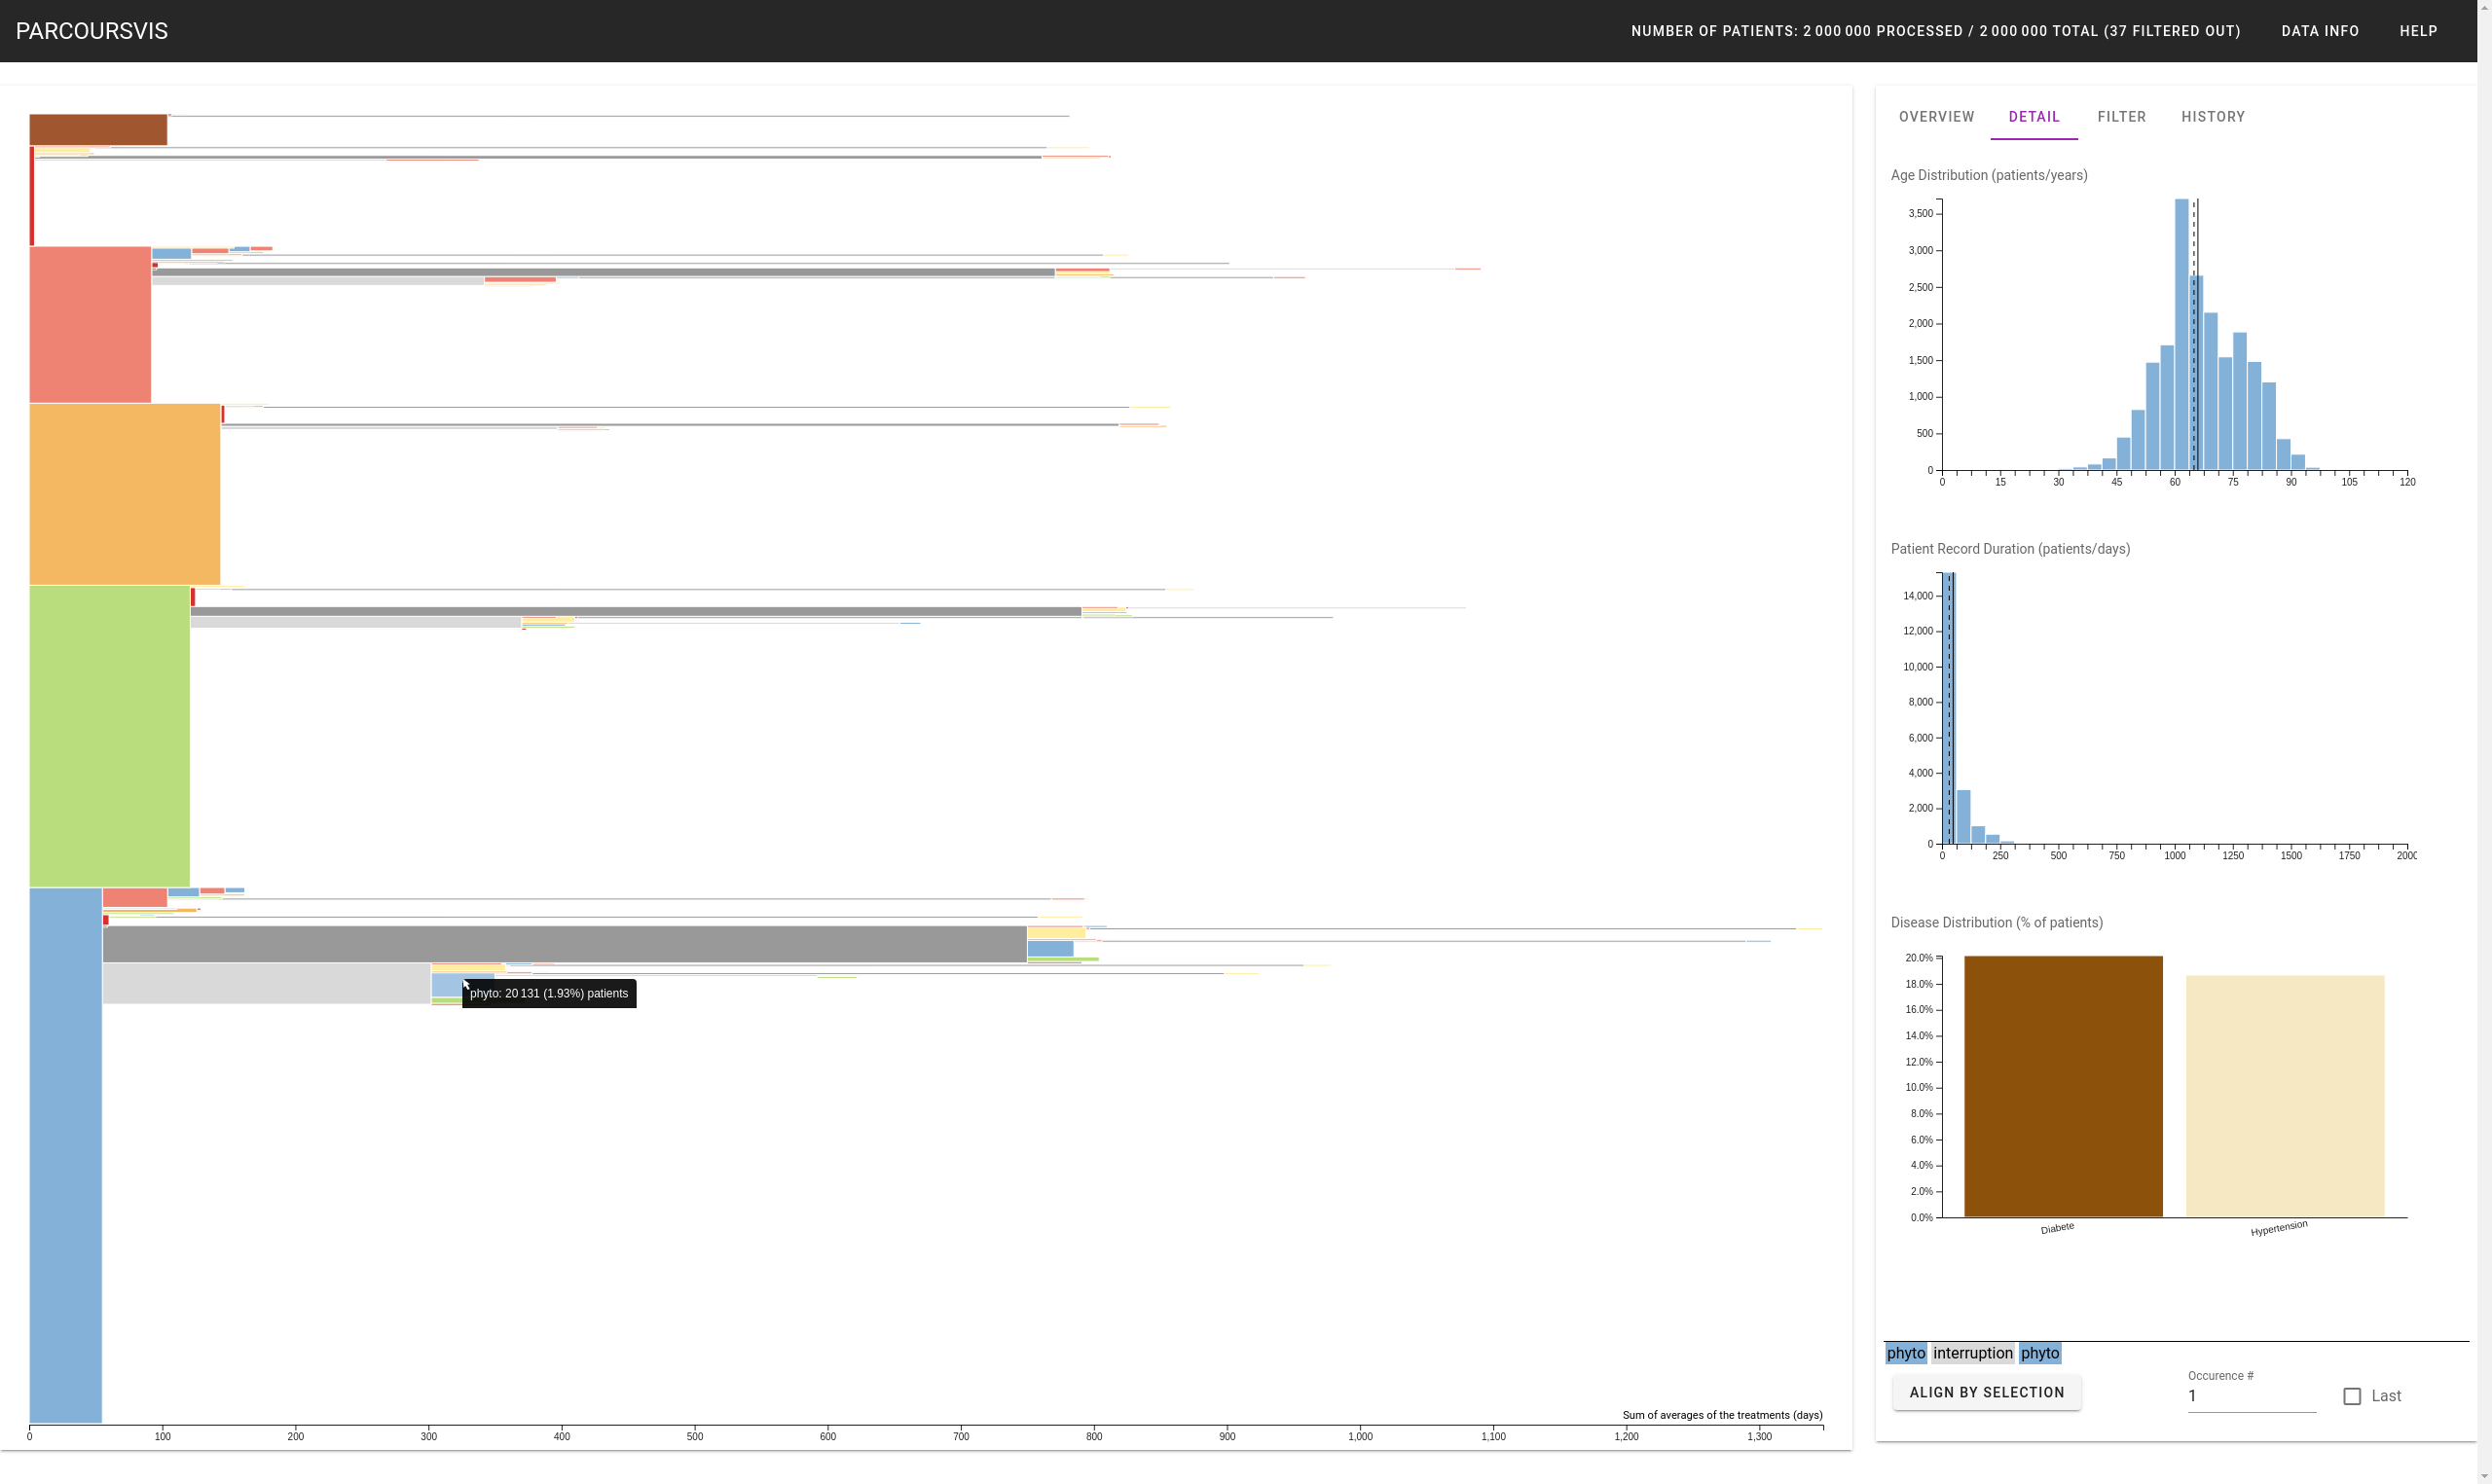
Hoverring over a node gives its type of high-level event, and the number of patients that have a pathway corresponding to this sequence of event. Clicking on the event will render, in the Detail Panel different demography distributions of the patients that have this sequence of events. Moreover, selecting a node displays the sequence of this node in the bottom right corner of the Sidebar.
For instance, the following screenshot shows the distribution of ages, duration, and co-morbidities of all the 20,131 patients that followed the following (but maybe uncomplete) care pathways (from older to newer) [phyto; no treatment; phyto].
Filter
The user can both filter the data by the patients the data is composed of, or by what the visualization system renders.
Filter the Patient -- Define a Cohort
The Filter Panel allows users to filter the patients by their age, co-morbidities, and the duration of their whole pathcare. Once filtered, the progressive algorithm is ran anew, and a new state is set in the History Panel. The user can then save this cohort by renaming the corresponding state in the History Panel.
Filter the Visualization
The Filter Panel also allows users to filter the resulting visualization without modifying the cohort. The user can show sequences up to a certain number of events cut when the number of patients is belowed the minimum number of patients per sequence. The user can also redefine the definition of the interuption and the no treatment events. Finally, the user can Zoom to see details of a particular sequence.
Zooming
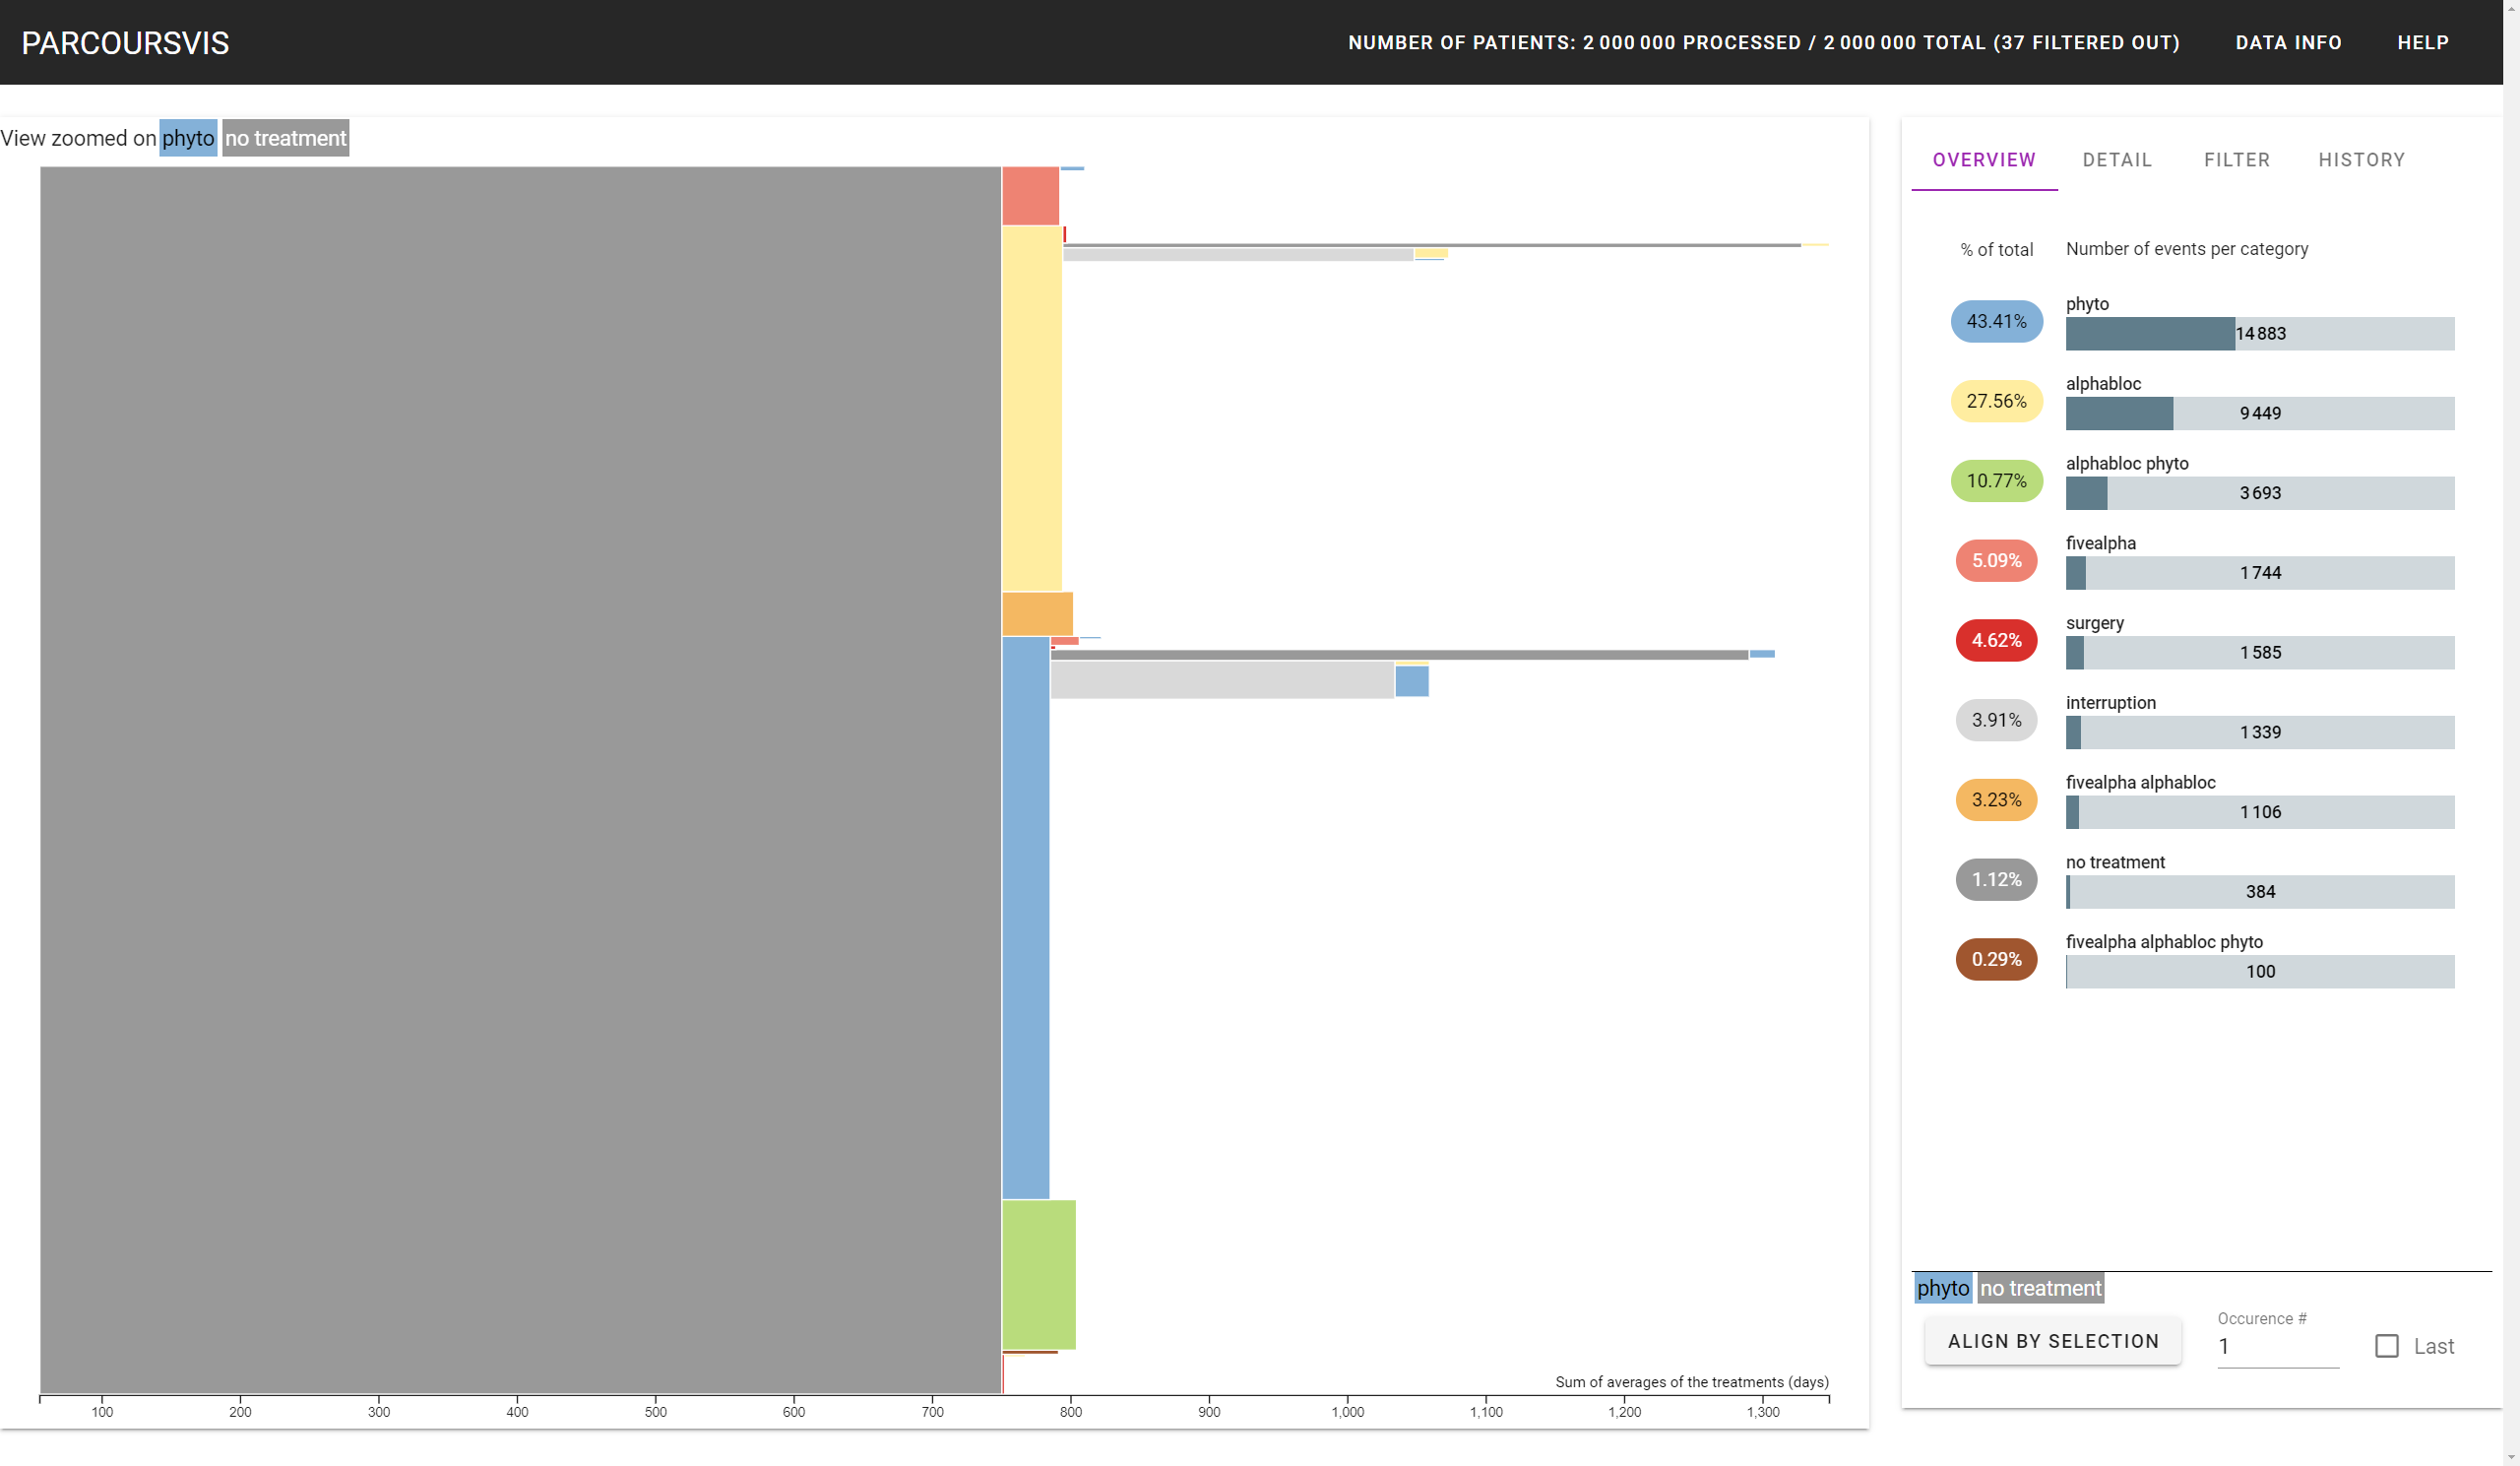
The user can zoom on a sequence by double clicking on it. The application renders the current sequence the user has zoomed on on the top of the visualization.
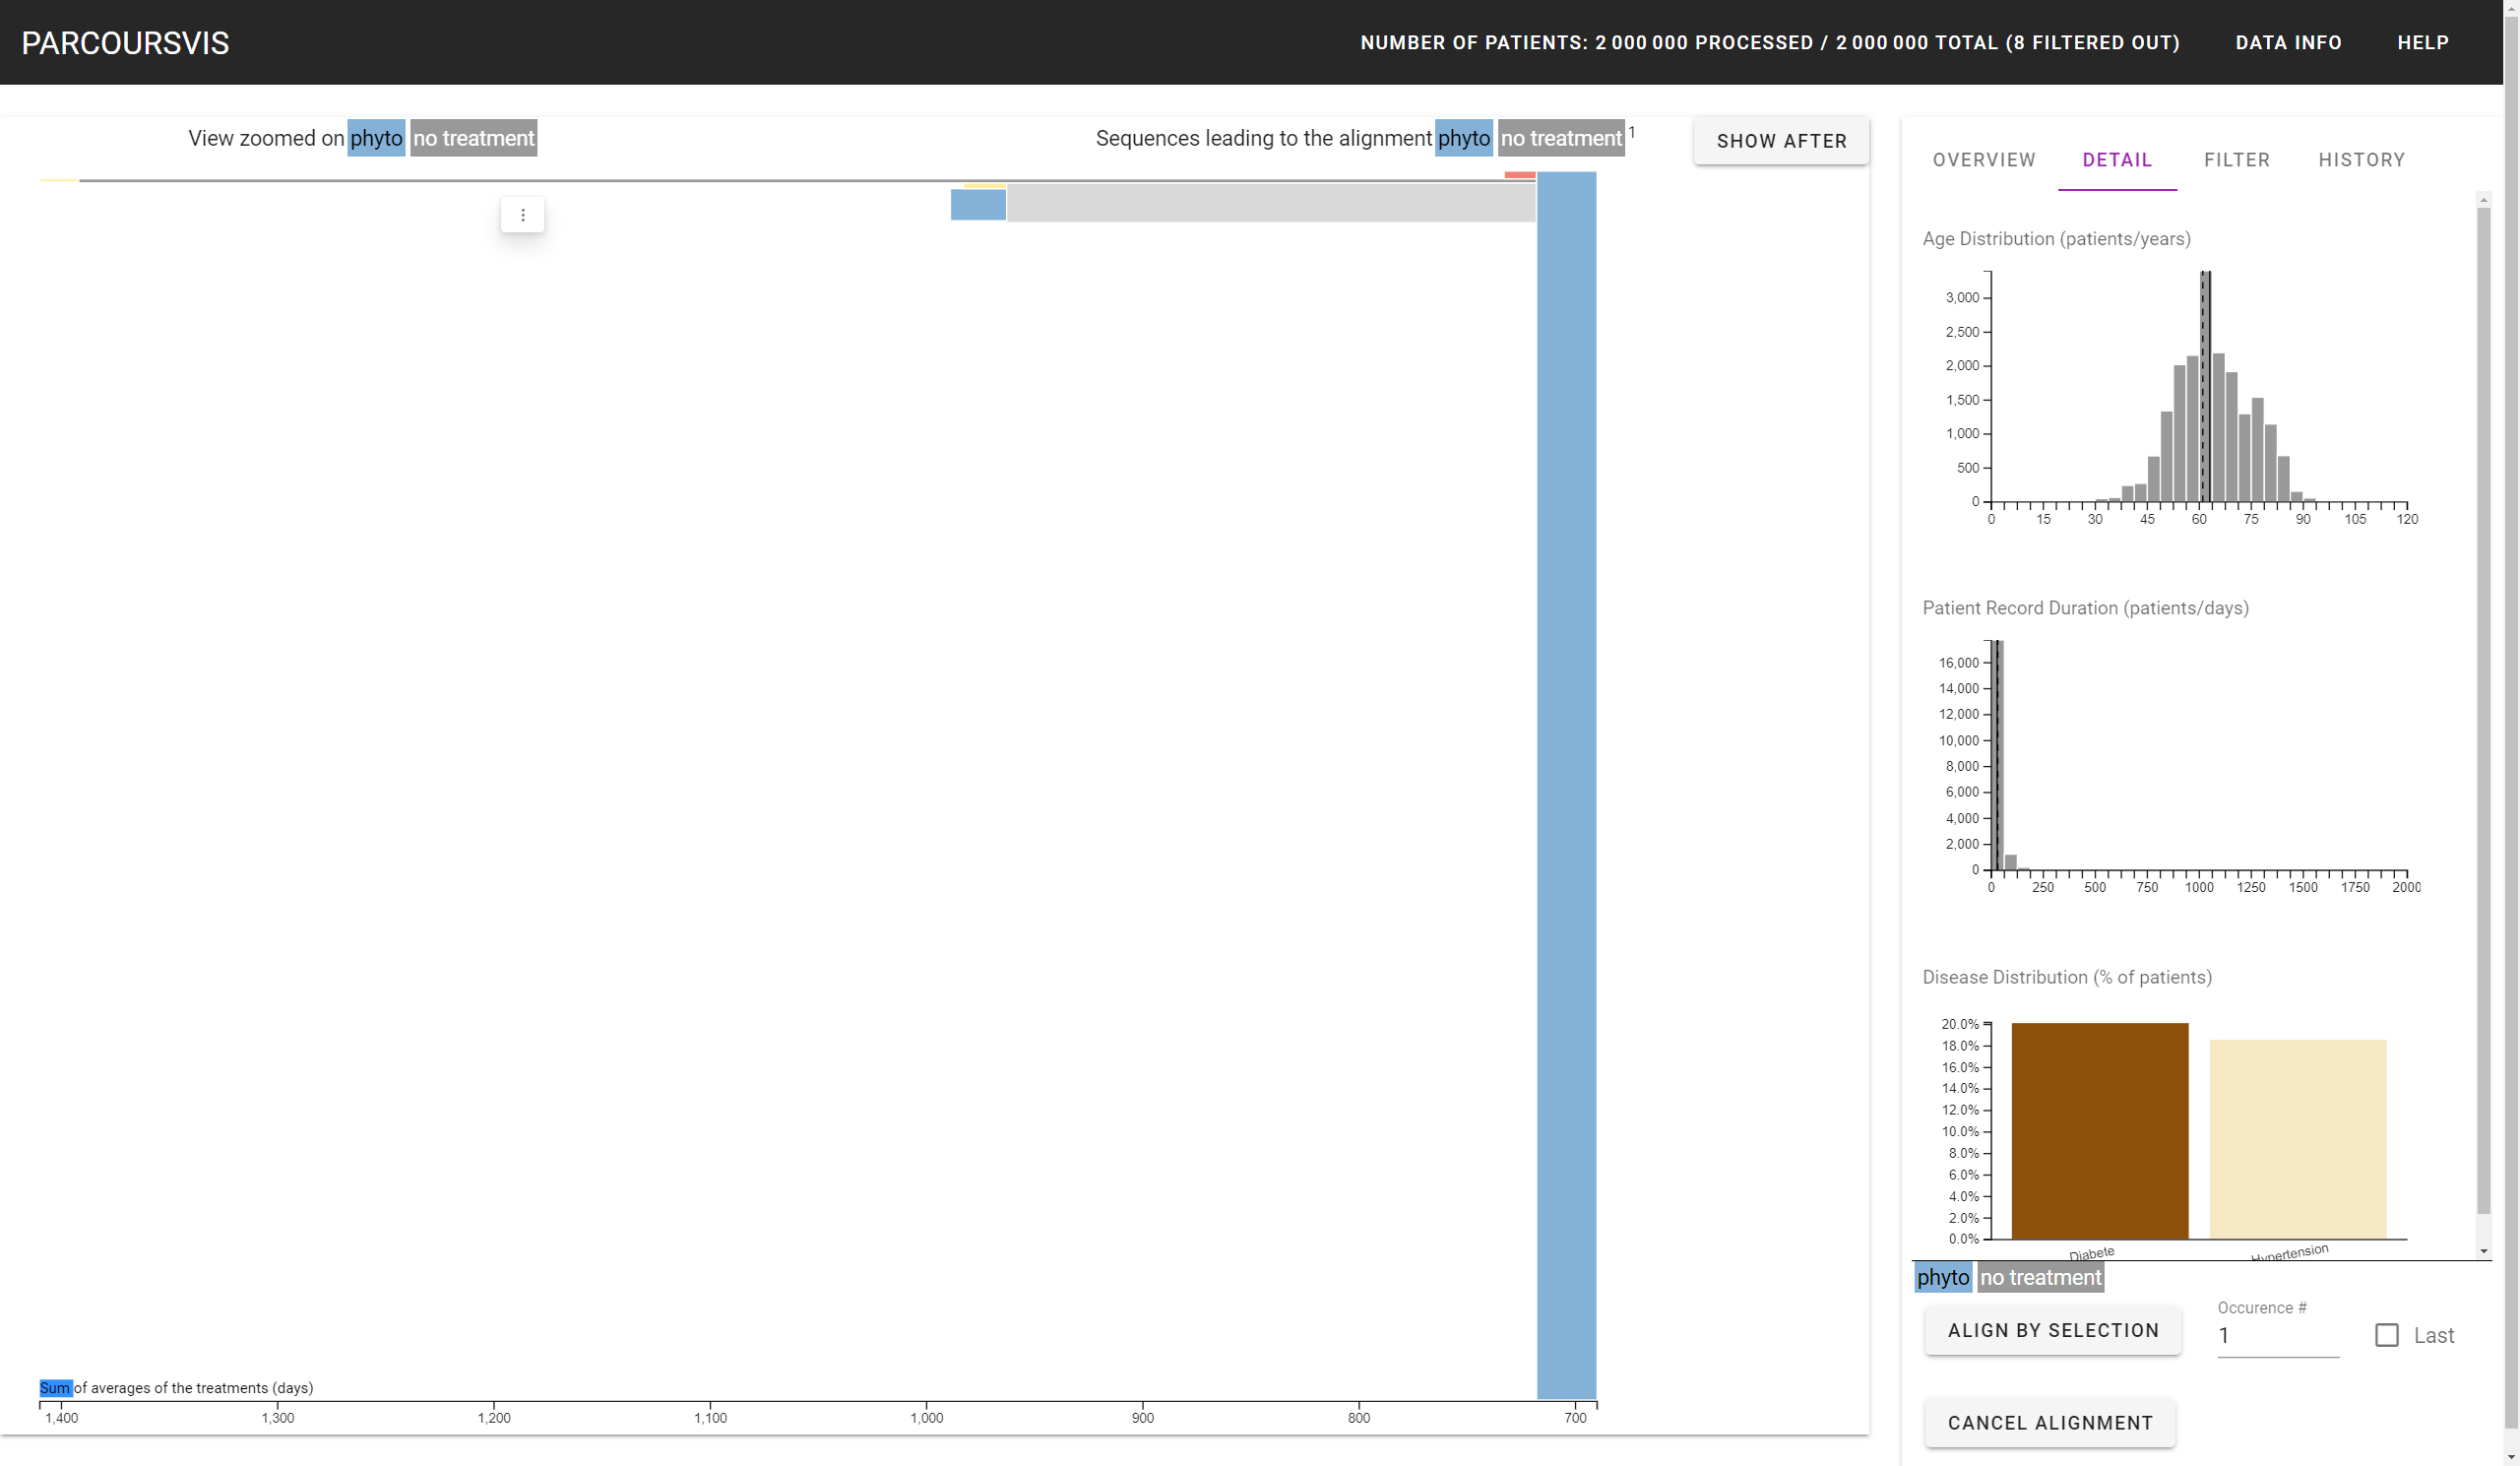
The user can have three zooming states:
- One for the Main View
- Two for the Aligned View?; one for the "leading to" sequences, and one for the "following to" sequences.
A double click on any white space of the visualization will unzoom the view, for the current view the user is in. The small offset around the visualization is also sensible to the double click.
Zooming will modify the number of events the Overview Panel. This panel will only show how many events, per type, the zoomed sequence is linked with, without counting the occurences of the sequence itself that the user has zoomed in. For instance, in the previous screenshot that shows the Main View, the Overview panel did not count the number of patients that followed the first occurence of "phyto" and the first occurence of "no treatment", as the user has zoomed in the sequence ["phyto", "no treatment"].
Undo/Redo
The user can undo and redo their actions either by manipulating the History Panel, or by pressing Ctrl+Z (undo) and Ctrl+Y (redo). The Redo functionalities allows user to "undo" previous undos, which starts anew each time the user presses a particular node in the History Panel.