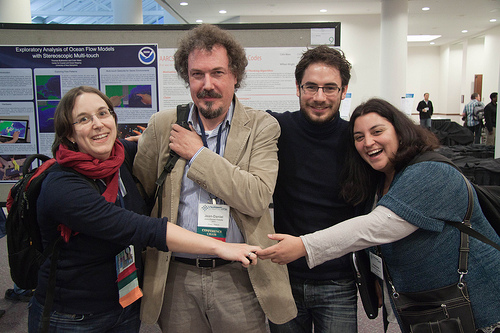
New: photos from the event (courtesy of Jason Chuang)
Visit the Aviz team right after CHI
On Friday 3rd May from 2PM to 4PM Aviz will be organizing a visit to give CHI attendees the opportunity to take a quick look at Aviz's current research on interactive information visualization.
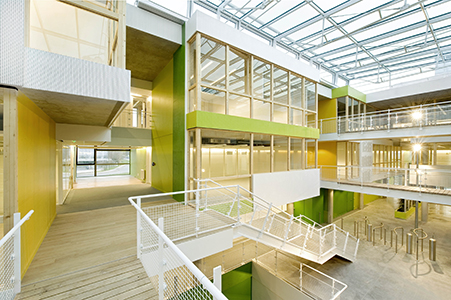
Aviz (as well as other HCI teams such as in situ and Limsi) is located at the Plateau de Saclay, at about 25km from Paris.
Signing Up
To participate you need to sign up by Thursday 2nd May 12PM. If you're not registered the caretaker of our lab may not let you in. Please bring an ID with you when you come to visit (e.g. an identity card, a passport, driving licence). Please sign up as soon as you can so we get an idea of the number of visitors. We may limit the number of visitors.
To sign up simply send an email to Nadia Boukhelifa <nb@lri.fr> with AVIZ VISIT as title. Later on, we may e-mail you back with updated information, so stay tuned.
Going to Aviz
The lab is between 1 hour and 1h30 from Paris by public transportation. It's a bit complicated so we'll have people show you the way.
- Meeting place: Denfert-Rochereau railway station main entrance. Note this is different from Denfert-Rochereau metro station (an adjacent underground station with the same name). Find out how to get to the meeting place here.
- Travel helpers:
- Andre Spritzer will wait up to 1:00 PM wearing an orange running shirt.
- Lan Qi (Chinese guy with glasses) will wait up to 1.30 PM wearing a grey hat with cherry spots.
- Basak Alper will wait up to 1:30 PM.
- We need more travel helpers! If you've already been to our lab and you don't mind waiting for other people, please send an email to Nadia Boukhelifa <nb@lri.fr>. We would greatly appreciate.
- Our travel helpers will leave right on time, so try not to be late! In case you miss them, make sure you have also read the 'Going by yourself' section below and printed the instructions page.
- Make sure you have already bought a two-way ticket for zones 1 to 5 before meeting our travel helpers (see detailed instructions here). In addition, you will need two regular metro tickets (also called t+) to take the bus (one to go to the lab, another one to come back).
Going by Yourself
- If you feel adventurous or have missed our helpers, follow our instructions on how to come here. UPDATE: this page has been updated on Thursday 25. If you already printed it, then you might want to print it again.
- In case of a problem, call <person TBD> at <cellphone number will be emailed to you the day before>.
List of Demos
All demos will take place in the same room in an informal manner. There is no specific schedule, so you can arrive after 2PM (but all demos will be over at 4PM).
 | Pierre Dragicevic and Fanny Chevalier | Animated transitions. We will present several new uses of animated transitions in user interfaces, including for quickly navigating in document editing histories, smoothly transitioning between markup code and documents and manipulating image histograms. Duration: about 15 minutes. |
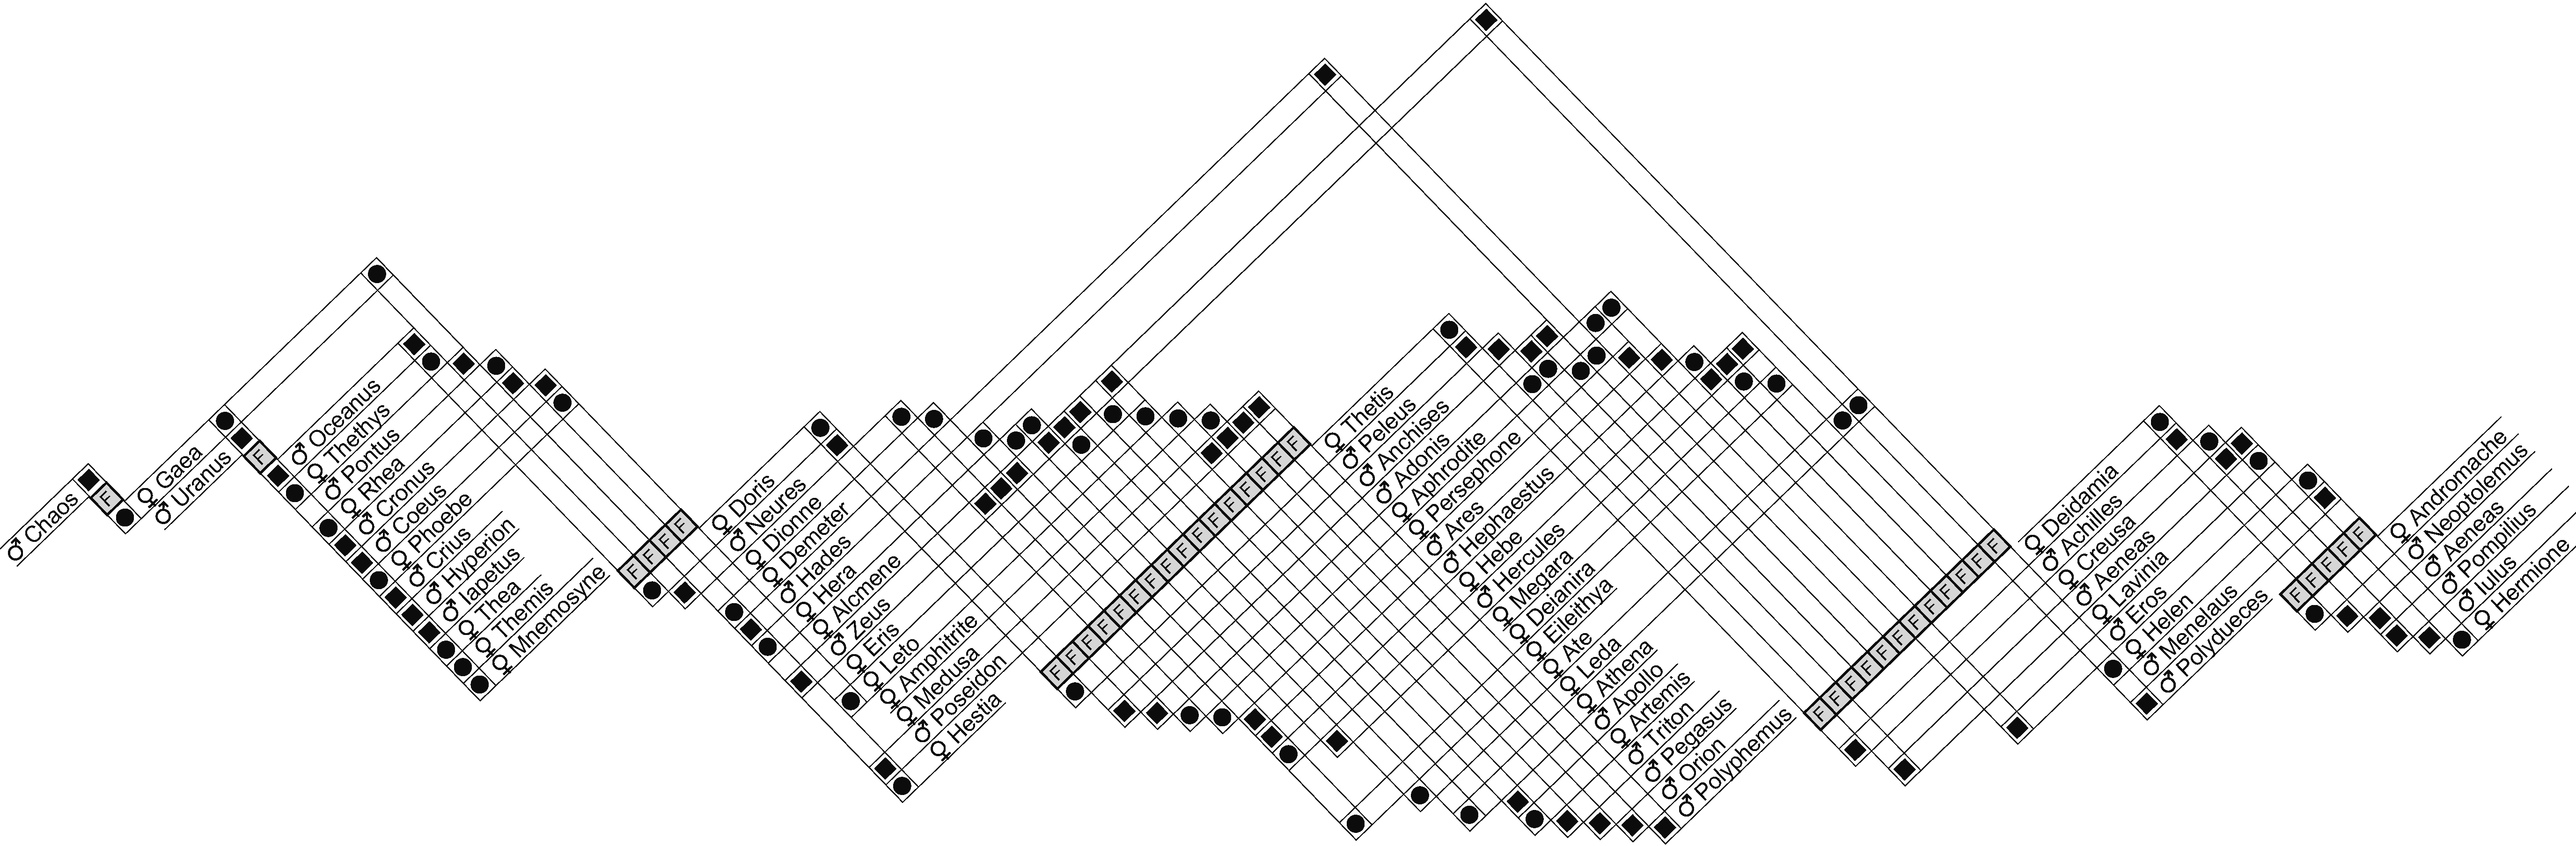 | Jean-Daniel Fekete | Exploring Large Genealogies with GeneaQuilts. I will show how large and complex genealogies can be explored using our novel representation, sometimes revealing surprising stories on families containing thousands of individual over centuries. Duration: 15mn. |
 | Petra Isenberg | Hybrid-Image Visualizations. We present our current research on visualizations that can be effectively viewed from two distances at the same time. Originally the technique was designed for our wall-sized display and collaborative viewing situations. The demo will be viewable on a poster today instead. Duration: 5-10mins. |
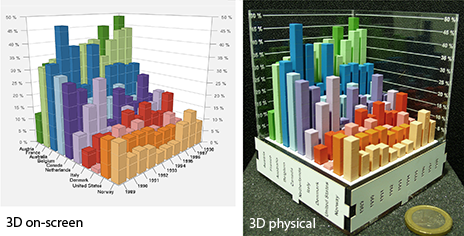 | Yvonne Jansen | Physical Visualizations. We present our current research on physical visualizations. Visitors will be free to explore our examples and try out all experimental conditions. Duration: about 10 minutes. |
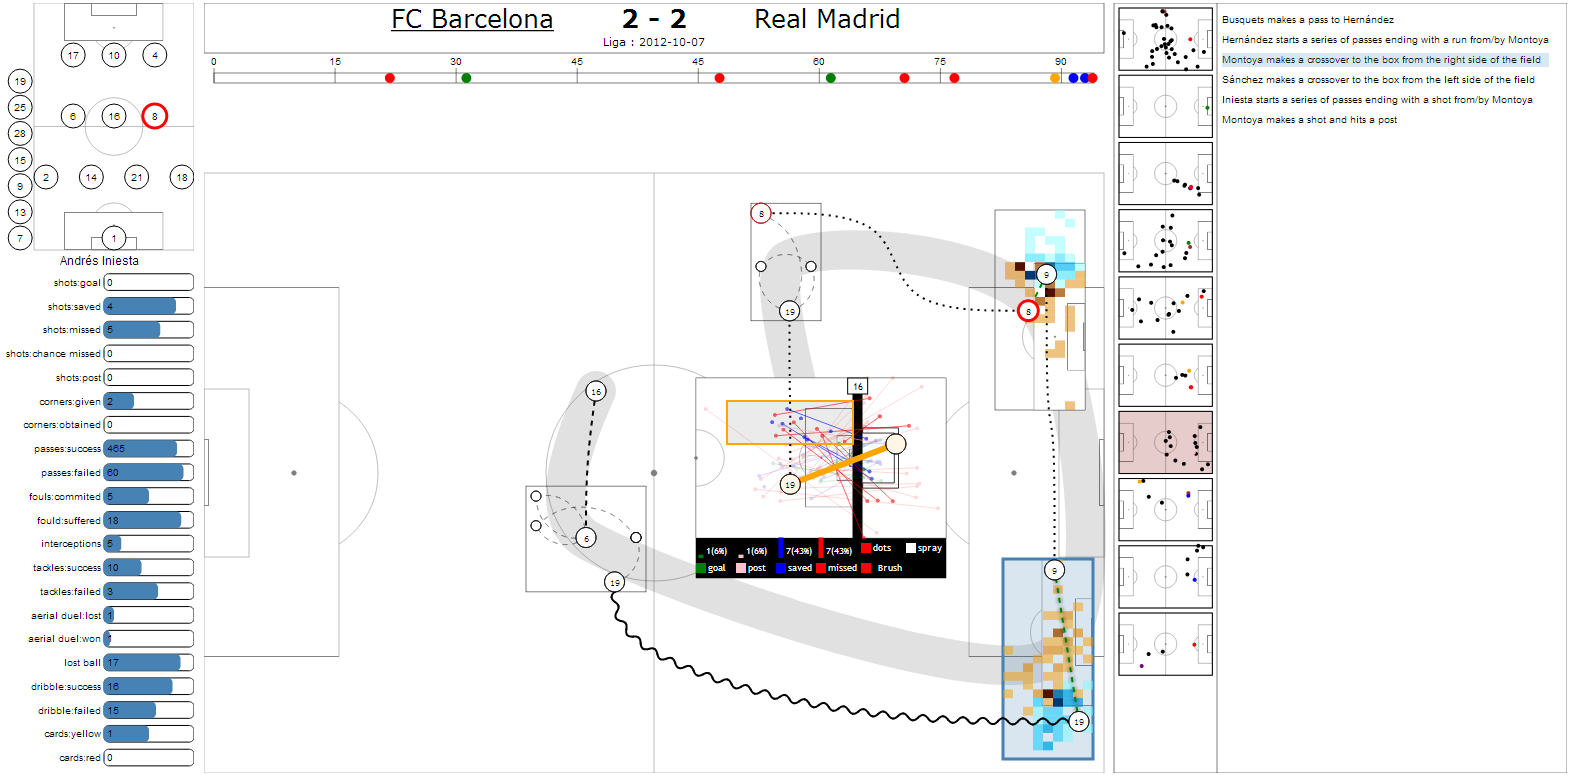 | Charles Perin | Soccer Visualization. We will present an original approach to the exploration of soccer games thanks to the SoccerStories visualization tool. Duration: about 15 minutes. |
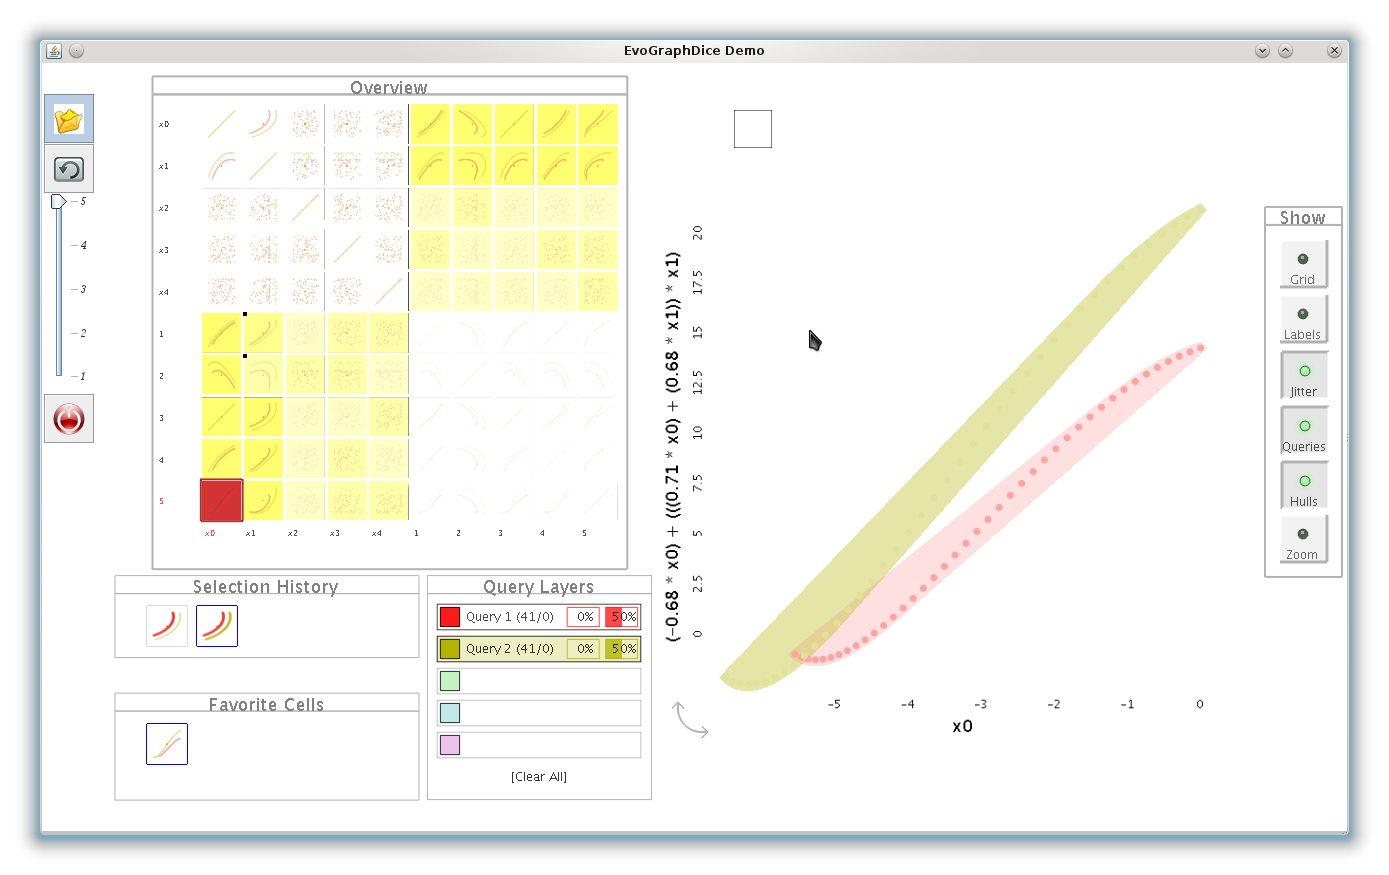 | Waldo Cancino | Evolutionary Visual Exploration. We present a prototype that combines visual analytics and stochastic optimisation to explore multidimensional datasets. Duration: 10 minutes. |
 | Tobias Isenberg | Touch-based interaction with 3D visualizations. Several techniques to interact with 3D spatial data on a 2D touch display: navigation in 3D (FI3D), selection of particle data (CloudLasso), integrated toolset for fluid flow data. Duration: 30–60min depending on group size and questions. |
Checklist
- Sign up by email at your earliest convenience
- Print the instructions on how to come
- Bring your ID
- Buy your travel tickets
Organizers
- Nadia Boukhelifa - nb@lri.fr
- Pierre Dragicevic - dragice@lri.fr