Visualizing Information on Smartwatches
Researchers
- Alaul Islam (Aviz)
- Petra Isenberg (Aviz)
- Anastasia Bezerianos (Université Paris-Saclay, CNRS, Inria, LRI)
- Bongshin Lee (Microsoft Research)
- Tanja Blascheck (University of Stuttgart)
Overview
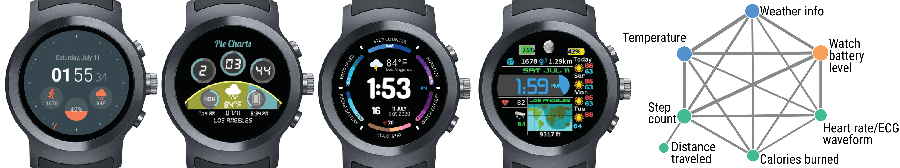
The goal of this project is to study very small data visualizations, micro visualizations, in display contexts that can only dedicate minimal rendering space for data representations. We will study human perception of and interaction with micro visualizations given small as well as complex data. The increasing demand for data visualizations on small mobile devices such as fitness tracking armbands, smartwatches, or mobile phones drives our research. It is still unclear to which extent our knowledge of desktop-sized visualizations transfers to contexts that involve minimal display space, diverse viewing angles, and moving displays.
While the last years have shown an increasing research interest in visualization for display walls, tables, tablets, or to a lesser extent mobile phones, our focus on small or moving displays is novel and timely while supporting realistic usage scenarios. Ultimately, our research aims to empower people to use visualizations outside a typical work environment furthering the research agenda of “beyond-the-desktop” visualizations. Example usage scenarios include fitness tracking armbands showing step counts or heart rates, hand-held GPS trackers showing elevation profiles, or mobile phone visualizations used in emergency response scenarios.
This project builds on and expands two existing research streams: data glyphs, which focus on studying data representations of multi-attribute dimensions, and word-scale visualizations such as sparklines, which focus on small visualizations embedded in text-documents. In this project, we consider these types of small visualizations together under the umbrella of “micro visualizations.”
Specifically, we define micro visualizations as small-scale visualizations that lack or have a limited set of reference structures such as labels, data axes, or grid lines and have a small physical footprint of a few square centimeters. Micro visualizations can be as simple as small unit-based visualizations such as a battery indicator but also include multi-dimensional visualizations such as star glyphs, small geographic visualizations or even small network visualizations. Although micro visualizations are essential to mobile visualization contexts, we know surprisingly little about their general visual and interaction design space or people's ability in interpreting micro visualizations. We will address this gap by proposing a common framework, conducting empirical studies to understand people's abilities to interpret these visualizations while in motion, and by developing a software toolkit to aid practitioners in developing micro visualizations for emerging mobile and wearable displays.
In summary, we aim at paving the way for the pervasive use of visualizations and thus a better and broader understanding of the complex world around us.
Publications
- Tanja Blascheck, Lonni Besançon, Anastasia Bezerianos, Bongshin Lee, Alaul Islam, Tingying He, Petra Isenberg (2023). Studies of Part-to-Whole Glanceable Visualizations on Smartwatch Faces. The 16th IEEE Pacific Visualization Symposium, April 18-21, 2023 in Seoul, Korea.
- Alaul Islam, Tanja Blascheck, and Petra Isenberg (2022). Context Specific Visualizations on Smartwatches. in: Posters of the European Conference on Visualization (EuroVis), The Eurographics Association, 2022.
- Alaul Islam, Lijie Yao, Anastasia Bezerianos, Tanja Blascheck, Tingying He, Bongshin Lee, Romain Vuillemot, and Petra Isenberg (2022). Reflections on Visualization in Motion for Fitness Trackers. in: Proceedings of the New Trends in HCI and Sports Workshop at MobileHCI, 2022.
- Alaul Islam, Ranjini Aravind, Tanja Blascheck, Anastasia Bezerianos, Petra Isenberg (2022). Preferences and Efectiveness of Sleep Data Visualizations for Smartwatches and Fitness Bands. CHI 2022 - Conference on Human Factors in Computing Systems, Apr 2022, New Orleans, LA, United States.
- Sheelagh Carpendale, Petra Isenberg, Charles Perin, Tanja Blascheck, Foroozan Daneshzand, Alaul Islam, Katherine Currier, Peter Buk, Victor Cheung, Lien Quach, Laton Vermette. Mobile Visualization Design: An Ideation Method to Try. Mobile Data Visualization, Chapman and Hall/CRC, pp.241-261, 2021.
- Islam, Alaul and Bezerianos, Anastasia and Lee, Bongshin and Blascheck, Tanja and Isenberg, Petra. Visualizing Information on Watch Faces: A Survey with Smartwatch Users. IEEE Visualization (IEEE VIS) 2020 short paper.
Supplementary Material
- Preferences and Efectiveness of Sleep Data Visualizations for Smartwatches and Fitness Bands - You can download the raw data and analysis code from the sleep viz studies (IRB approved under ref. no CER-Paris-Saclay-2021-015).
- Visualizing Information on Watch Faces: A Survey with Smartwatch Users - You can download the raw data and analysis code from the survey (IRB approved under ref. no Paris-Saclay-2020-002 CER).