Glanceable Visualizations for Smartwatches
Researchers
- Tanja Blascheck (Aviz)
- Petra Isenberg (Aviz)
- Lonni Besancon (Linköping University)
- Anastasia Bezerianos (In-Situ, U-PSud/INRIA/CNRS)
- Bongshin Lee (Microsoft Research)
Overview
The goal of this project is to study very small data visualizations, micro visualizations, in display contexts that can only dedicate minimal rendering space for data representations. We will study human perception of and interaction with micro visualizations given small as well as complex data. The increasing demand for data visualizations on small mobile devices such as fitness tracking armbands, smartwatches, or mobile phones drives our research. Given this usage context, we focus on situations in which visualizations are used “on the go,” while walking, riding a vehicle, or running. It is still unclear to which extent our knowledge of desktop-sized visualizations transfers to contexts that involve minimal display space, diverse viewing angles, and moving displays.
While the last years have shown an increasing research interest in visualization for display walls, tables, tablets, or to a lesser extent mobile phones, our focus on small or moving displays is novel and timely while supporting realistic usage scenarios. Ultimately, our research aims to empower people to use visualizations outside a typical work environment furthering the research agenda of “beyond-the-desktop” visualizations. Example usage scenarios include fitness tracking armbands showing step counts or heart rates, hand-held GPS trackers showing elevation profiles, or mobile phone visualizations used in emergency response scenarios.
This project builds on and expands two existing research streams: data glyphs, which focus on studying data representations of multi-attribute dimensions, and word-scale visualizations such as sparklines, which focus on small visualizations embedded in text-documents. In this project, we consider these types of small visualizations together under the umbrella of “micro visualizations.” Specifically, we define micro visualizations as small-scale visualizations that lack or have a limited set of reference structures such as labels, data axes, or grid lines and have a small physical footprint of a few square centimeters. Micro visualizations can be as simple as small unit-based visualizations such as a battery indicator but also include multi-dimensional visualizations such as star glyphs, small geographic visualizations or even small network visualizations. Although micro visualizations are essential to mobile visualization contexts, we know surprisingly little about their general visual and interaction design space or people's ability in interpreting micro visualizations. We will address this gap by proposing a common framework, conducting empirical studies to understand people's abilities to interpret these visualizations while in motion, and by developing a software toolkit to aid practitioners in developing micro visualizations for emerging mobile and wearable displays.
In summary, we aim at paving the way for a pervasive use of visualizations and thus a better and broader understanding of the complex world around us.
Study Data
InfoVis 2018 Study Data: supplemental material
Videos
InfoVis 2018 Fast Forward: video
Publications
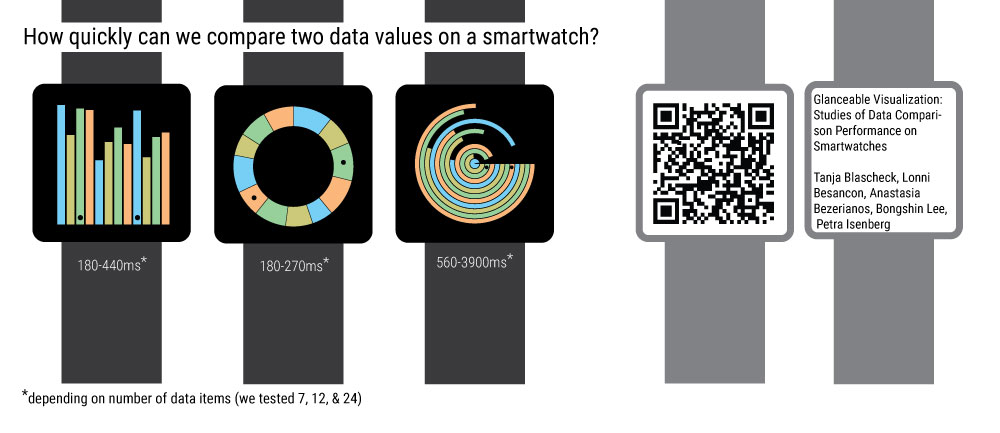
Blascheck, Tanja and Besancon, Lonni and Bezerianos, Anastasia and Lee, Bongshin and Isenberg, Petra. Glanceable Visualization: Studies of Data Comparison Performance on Smartwatches. IEEE Transactions on Visualization and Computer Graphics, 2018
Blascheck, Tanja and Bezerianos, Anastasia and Besancon, Lonni and Lee, Bongshin and Isenberg, Petra. Preparing for Perceptual Studies: Position and Orientation of Wrist-worn Smartwatches for Reading Tasks MobileVis ’18 Workshop at CHI, 2018.
Blascheck, Tanja and Besancon, Lonni and Bezerianos, Anastasia and Lee, Bongshin and Isenberg, Petra. Perception des visualisations sur smartwatch. Journée Visu, 2018