Description
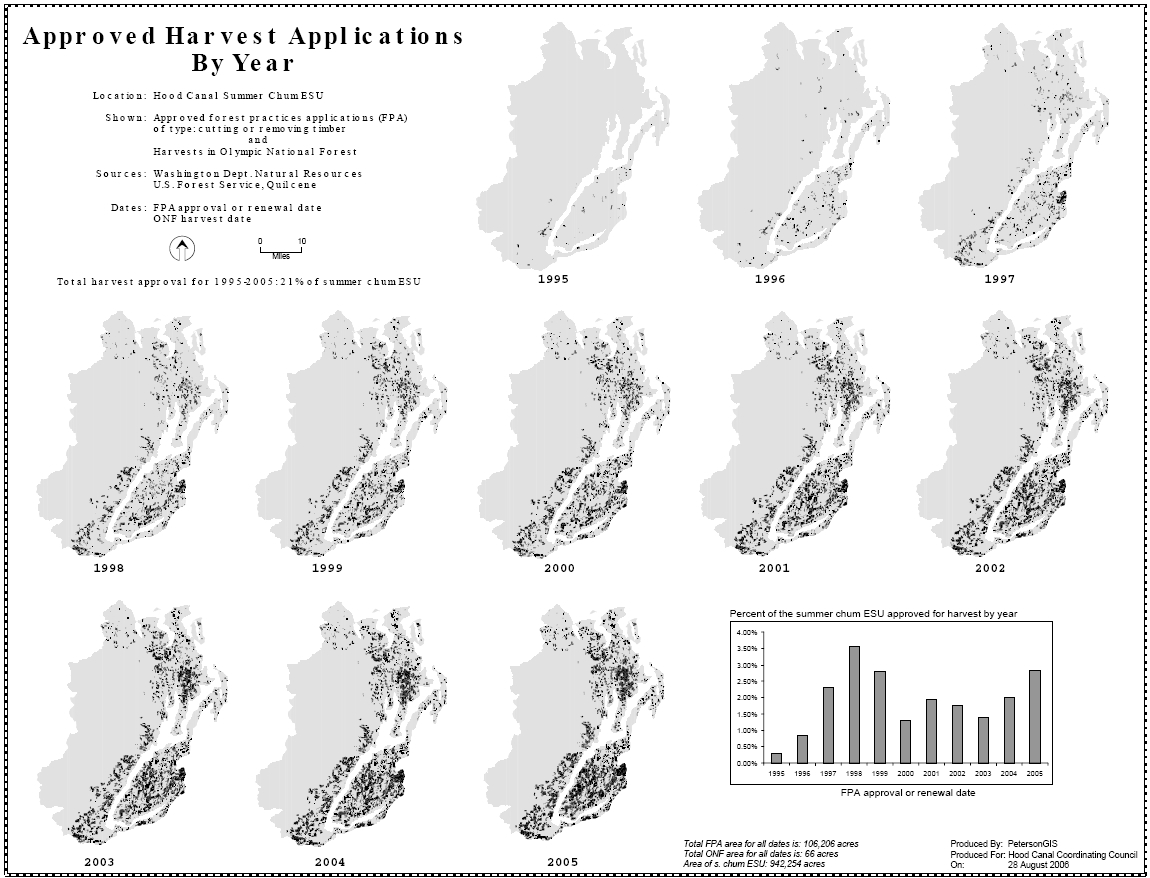
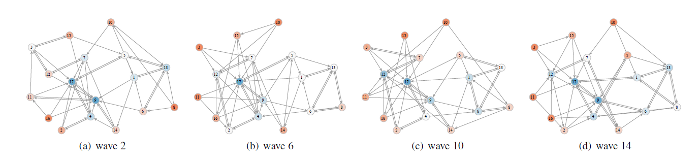
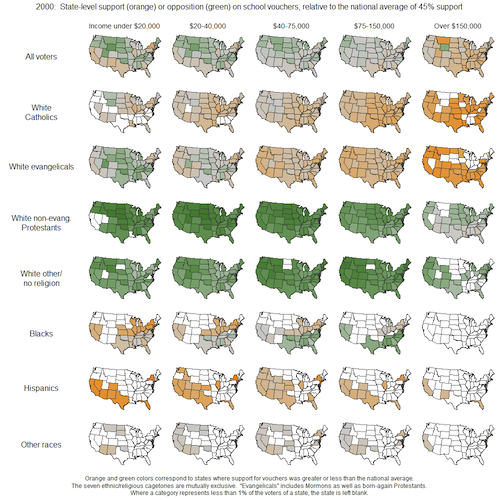
Small multiples are a common way to present spatio-temporal data (Fig. 1), but also networks that change over time (Fig. 2), or multiple aspects of the same data set (Fig. 3). Each image shows data either at one time step or one aspect of the data. Laid out on the screen, small multiples can give a quick overview of the general trend and outliers in the data set. However, as the number of time steps and the details to show in each image increase, small multiples get difficult to read.
Common techniques to navigate this space are pan and zoom, as well as highlighting elements across the images. To visualize changing networks, difference between two states have been highlighted between individual images. However, pan and zoom might solve the problem of readability but lead to a loss of context.
Goals
We are seeking for creative interaction and visualization ideas on how to enhance the exploration of such visualizations. Questions are:
- How can the users communicate which image they are interested in?
- How to compare two or more distant images?
- How can users interact with the images?
- Which visualizations allow to summarize information across the small multiples?
- How to filter and aggregate information?
- What input and output techniques would be substantially improve small multiples (multitouch, large displays)?
Related
- http://www.win.tue.nl/~selzen/paper/EuroVis2013.pdf
- Jo Wood, Jason Dykes and Aidan Slingsby - Visualisation of Origins, Destinations and Flows with OD Maps
Requirements
Depending on in which part of the project the student is most interested, different skills are necessary:
- Preferred programming environment is Java or D3
- Creative mind and enjoying discussions
- Supervision will be in English