Interactive Exploration of Standard Visualizations
Motivation
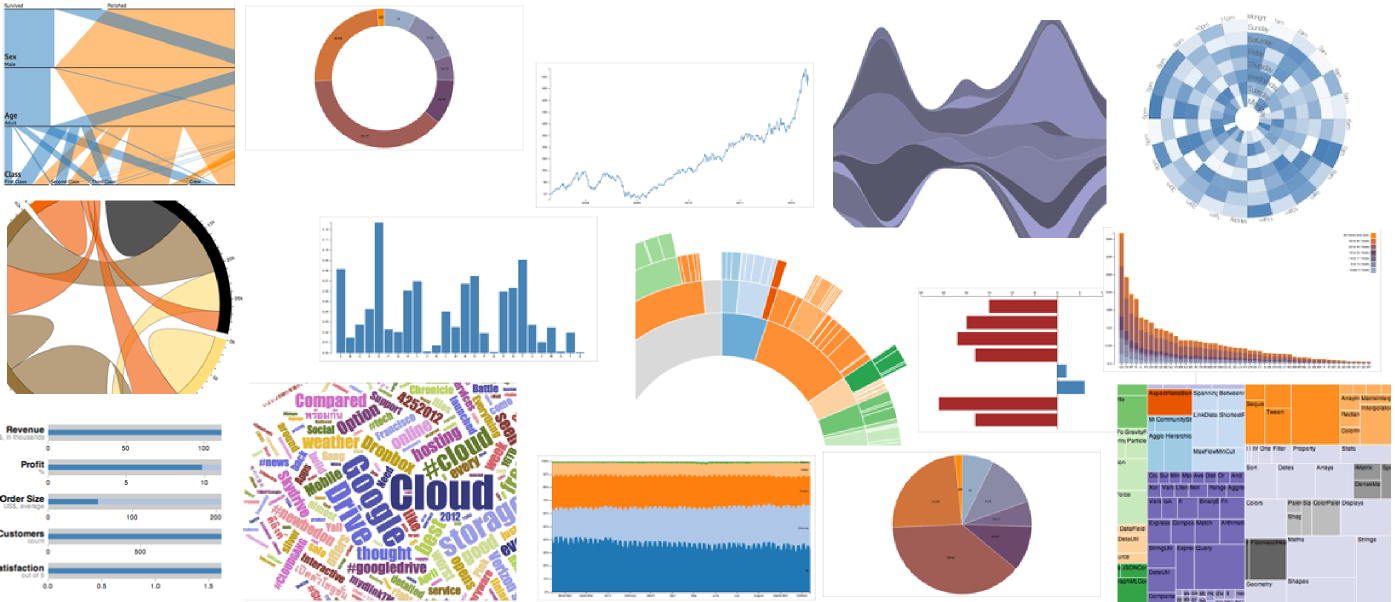
Standard visualizations have evolved from basic charts (e.g., bar charts, line charts, pie charts) to more advanced ones (e.g., stacked graphs, treemaps, chord diagrams), and web libraries such as D3 have made easier to create and more accessible these visualizations. However, exploring visualizations can still be improved. We showed that adding simple interactions to Horizon Graphs enhance their performance and usability (see the Interactive Horizon Graphs project page). Instead of designing more and more new visualization techniques, we want to investigate on how to enhance existing visualizations using generic interactions.
Goal
The goal of the project is to identify which interactions can be used in a generic way to a broad range of visualizations, and the internship may proceed in several phases:
- Applying the pan and zoom technique from the Interactive Horizon Graphs to standard charts.
- Designing new generic interaction techniques.
- Exploring how these interactions apply to more advanced visualizations and evaluate their effectiveness.
- Ideally, the project will end with a D3 plugin to easily create interactive charts.
Requirements
- The project will be implemented using D3 (d3.js) in HTML5/Javascript to work on any modern browser. The candidate should be familiar with this environment.
- The communication about this project will be in English and French.
Related Publication
Charles Perin, Frédéric Vernier, Jean-Daniel Fekete. Interactive Horizon Graphs: Improving the Compact Visualization of Multiple Time Series. Proceedings of the 2013 Annual Conference on Human Factors in Computing Systems (CHI 2013), Apr 2013, Paris, France. ACM
Supervision
The project will be supervised by Charles Perin and Jean-Daniel Fekete