Sketchiness as a Visual Variable to Depict Qualitative Uncertainty
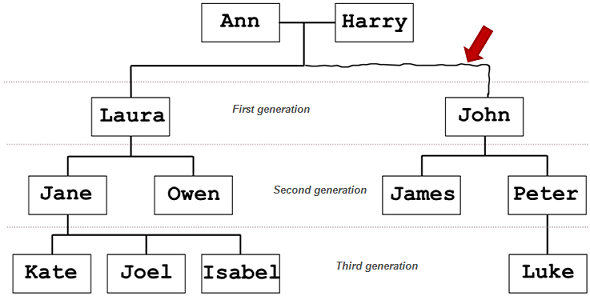
Sketchiness, inspired by features of hand-drawn strokes, was applied to the rendering of edges in a graph. The more sketchy the line, the more uncertain is the connection between the nodes.
Description
We report on results of a series of user studies on the perception of four visual variables that are commonly used in the literature to depict uncertainty. In addition to blur, dashing and grayscale, we investigate the use of ‘sketchiness’ as a visual variable because it conveys visual impreciseness that may be associated with data quality. Inspired by work in non-photorealistic rendering and by the features of hand-drawn lines, we generate line trajectories that resemble hand-drawn strokes of various levels of proficiency—ranging from child to adult strokes—where the amount of perturbations in the line corresponds to the level of uncertainty in the data.
Our results show that sketchiness is a viable alternative for the visualization of uncertainty in lines and is as intuitive as blur; although people subjectively prefer dashing style over blur, grayscale and sketchiness. We discuss advantages and limitations of each technique and provide design considerations on how to deploy these visual variables to effectively depict various levels of uncertainty for line marks.
Download
You can find all related material to the studies here.
Publications
Nadia Boukhelifa, Anastasia Bezerianos, Tobias Isenberg, Jean-Daniel Fekete. Evaluating Sketchiness as a Visual Variable for the Depiction of Qualitative Uncertainty. In IEEE InfoVis '12: IEEE Transactions on Visualization and Computer Graphics, Oct 2012, Seattle, USA.
Nadia Boukhelifa, Anastasia Bezerianos, Tobias Isenberg, Jean-Daniel Fekete. Evaluating Sketchy Lines for the Qualitative Visualization of Uncertainty, Technical Report PR-7910, INRIA, France, March 2012.