ProgressiVis Tutorial at IEEE VIS 2025
Organizers
- Jean-Daniel Fekete, Senior Research Scientist, Inria, France
- Christian Poli, Research Engineer, Inria, France
Place & Time
- Monday, November 3rd, 14:00 - 17:30
- Place: Room 1.85 + 1.86
Introduction
You are warmly invited to participate in the first ProgressiVis tutorial, held on Monday, November 3rd, at the IEEE VIS 2025 Conference in Vienna, Austria, from 2:00 pm to 5:30 pm.
If you wonder how visualization and data exploration will scale to huge datasets and powerful algorithms, including machine learning and simulation, progressive data analysis and visualization (PDAV) is one of the most promising solutions. Yet, it may take a few years before it becomes mainstream, as it still needs more basic research. The ProgressiVis Toolkit serves as an enabler for this research.
This tutorial provides a basic, beginner’s introduction to PDAV using the ProgressiVis Toolkit, an experimental, open-source toolkit for implementing scalable visualization and visual analytics systems. It is intended for researchers and practitioners who want to understand how PDAV works and design progressive visualizations—alone or in coordination with data analysis algorithms (e.g., dimensionality reduction, clustering, and machine learning in general), or progressive data management methods.
How?
The scalability is made possible by addressing a major bottleneck of interactive data analysis: latency. In current interactive visualization systems, as data grows, latency increases and, beyond a certain size, response times become too slow to sustain interactivity. Progressive systems address this limitation by splitting long-running operations into a sequence of short runs, providing a quick initial but approximate visualization that improves over time. This allows analysts to maintain attention and to answer analytical questions, usually much earlier than if they had to wait for all the data to be processed. However, progressive systems also come with caveats.
Why?
Implementing progressive systems from scratch is notoriously complex, partly because existing data analysis libraries do not provide the right level of support to split lengthy computations into smaller iterative runs. Many mechanisms we consider “primitives” in existing programming languages should be reimplemented in a progressive way. The ProgressiVis Toolkit provides the necessary foundational mechanisms and software modules to quickly start building and extending progressive applications. It provides a unified architectural model for implementing progressive data analysis and visualization, as well as prototypes for many visualization techniques and data analysis algorithms working in a progressive way.
Benefits
Progressive Data Analysis provides the following benefits:
- Scalability for visualization in terms of data size and download time
- Scalability for interactive analysis including machine learning
- Instant data, no need to wait for data and visualization to arrive
- Greener computing, processing only the required data to get a result
- Algorithmic transparency, the possibility to monitor and visualize data processing as it runs.
Practical Information
Please install ProgressiVis Toolkit on your laptop before attending the workshop to save time.
Generic instructions are available in the ProgressiVis documentation.
Do not use Python 3.14 yet; many important packages are still missing. Use Python 3.13! .
For the tutorial, open a console, connect to a directory suitable for storing the tutorial files, and type:
# Preferably use Anaconda or Miniconda with
conda create -n pvenv python=3.13
conda activate pvenv

pip install 'progressivis[jupyter]'
pip install matplotlib jupytext anywidget
git clone https://github.com/progressivis/progressivis-tutorial.git
cd progressivis-tutorial
sh sync.sh
The last command will only work on Linux, macOS, and Windows with the WSL subsystem installed. Otherwise, for Windows, you'll have to transform the Python files into notebooks by hand using the jupytext command.
You also need to set up your Jupyter Lab environment by setting the following options in the Settings:
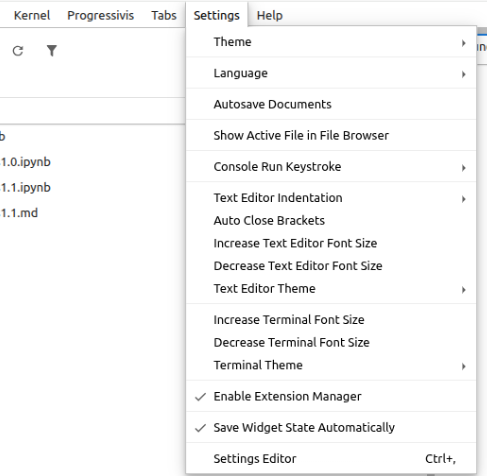
For participants who are unable to install it on their own computers, we will also provide a JupyterHub environment. Connection to the MyDocker environment: LATER
See also
Jean-Daniel Fekete, Danyel Fisher, and Michael Sedlmair, Progressive Data Analysis: Roadmap and Research Agenda, Eurographics Association, ISBN: 978-3-03868-270-7, DOI: 10.2312/pda.20242707, Nov. 2024