Supporting The Design and Fabrication of Physical Visualizations
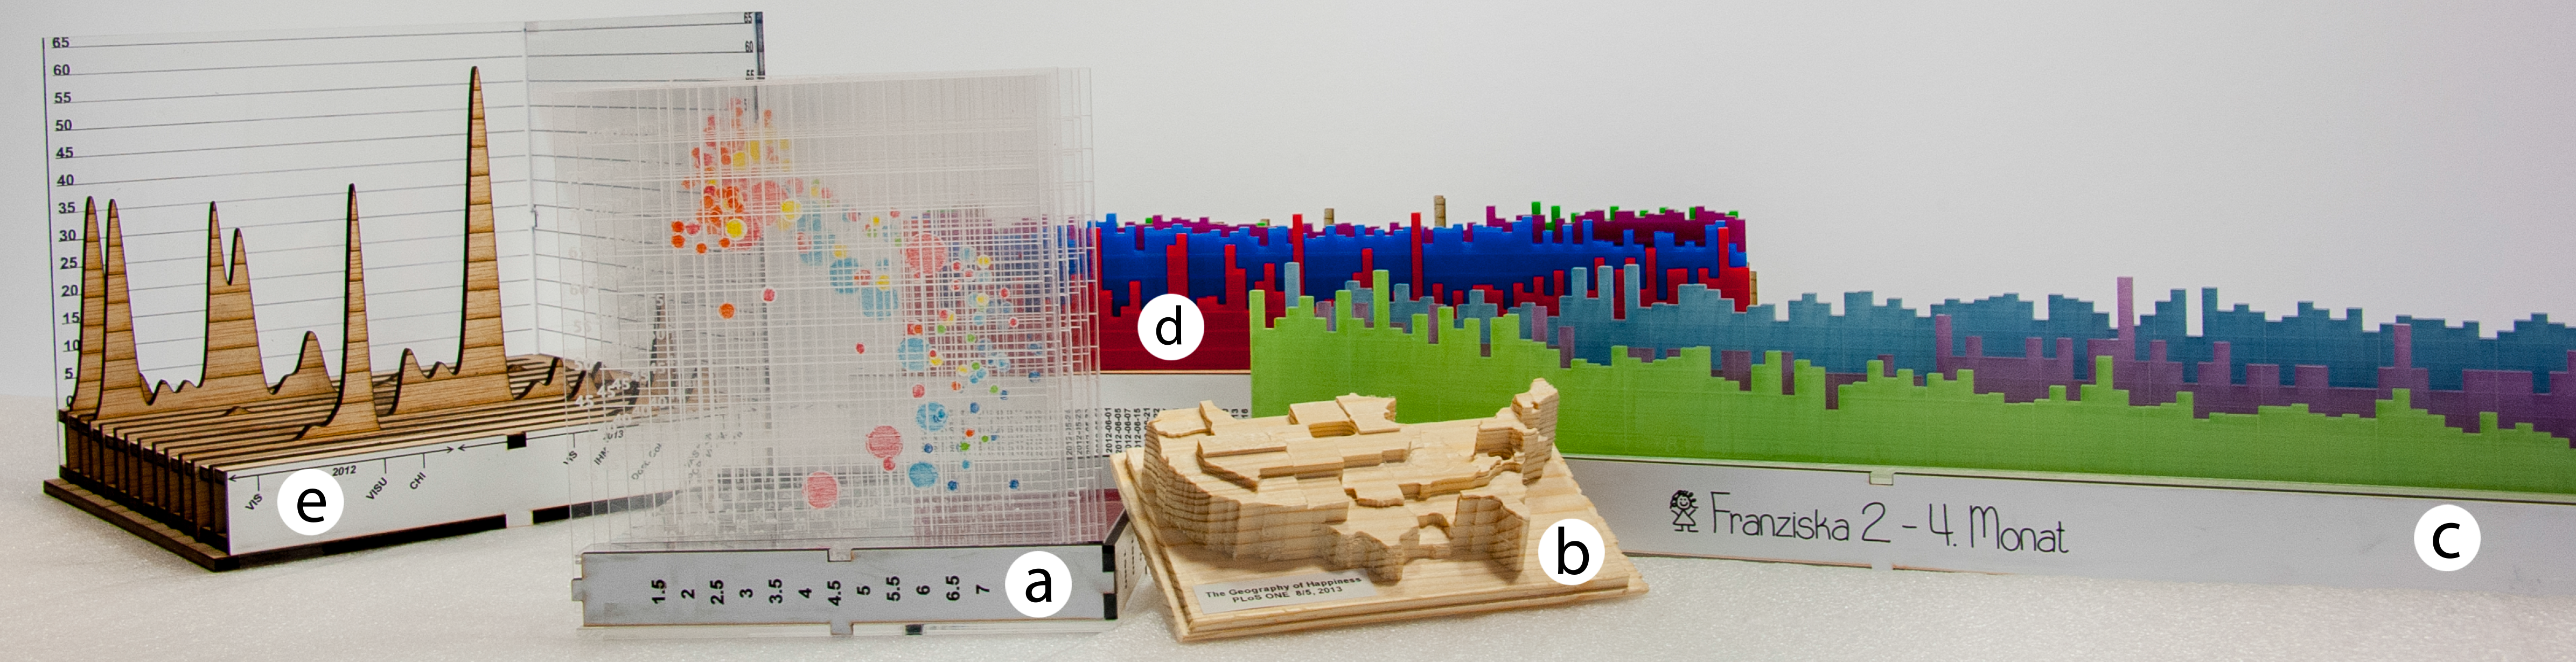
Physical visualizations created with our fabrication tool MakerVis: a) a scatterplot created after Hans Rosling’s TED talk, b) a prism map showing happiness across the US computed from Twitter sentiments, c),d),e) visualizations created by users during design sessions.
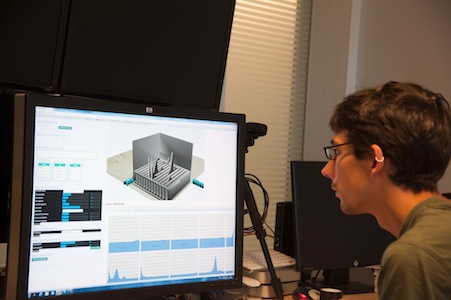
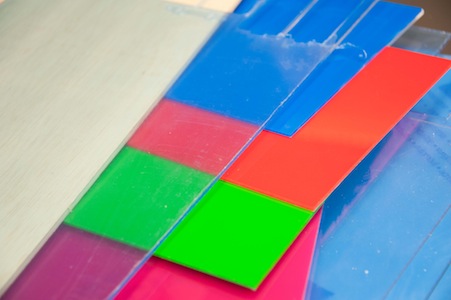
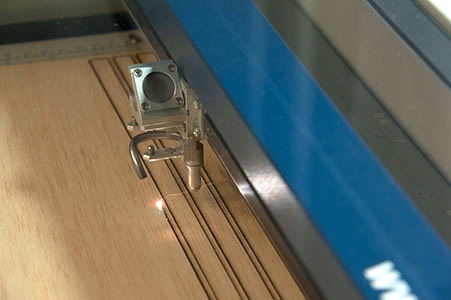
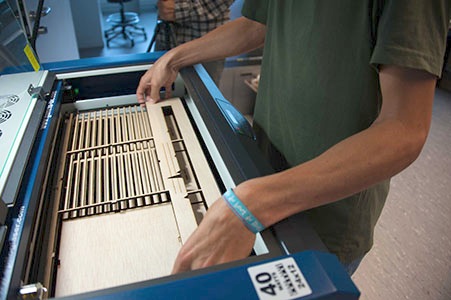
An increasing variety of physical visualizations are being built, for purposes ranging from art and entertainment to business analytics and scientific research. However, crafting them remains a laborious process and demands expertise in both data visualization and digital fabrication. We illustrate the limitations of current workflows through three real case studies. We then present the MakerVis prototype, the first tool that integrates the whole workflow, from data filtering to physical fabrication. Design sessions with three end users shows that tools such as MakerVis can dramatically lower the barriers behind producing physical visualizations. Observations and interviews also revealed important directions for future research. These include rich support for customization, and extensive software support for materials that accounts for their unique physical properties as well as their limited supply.
Article
Saiganesh Swaminathan, Conglei Shi, Yvonne Jansen, Pierre Dragicevic, Lora Oehlberg, Jean-Daniel Fekete. Supporting the Design and Fabrication of Physical Visualizations. Proceedings of the 2014 Annual Conference on Human Factors in Computing Systems (CHI 2014), Apr 2014, Toronto, ON, Canada. pp.3845--3854

Video
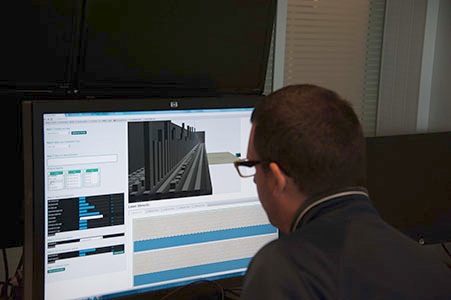
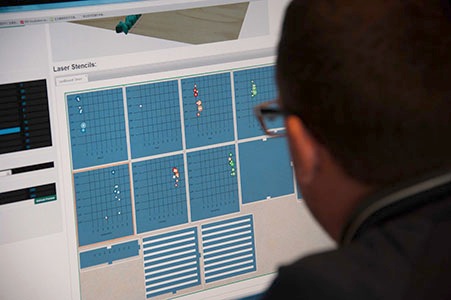
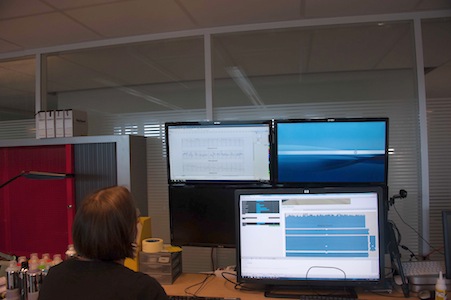
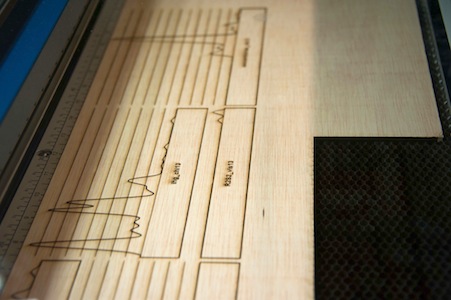
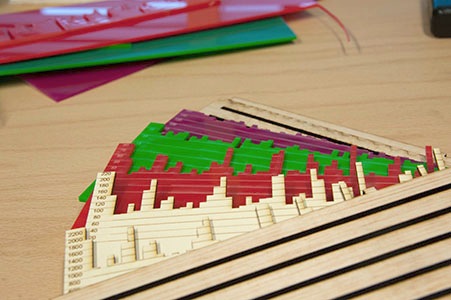
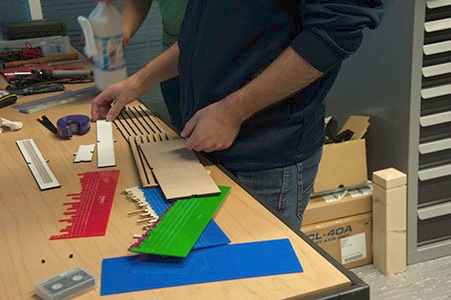
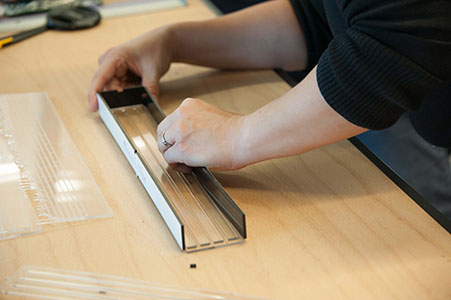
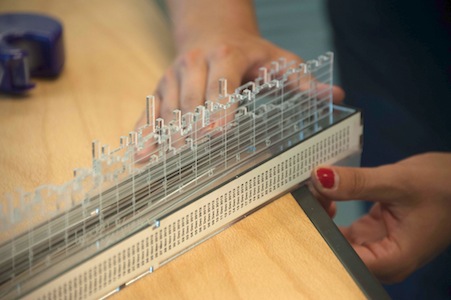
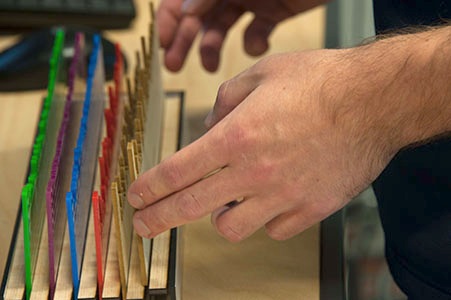
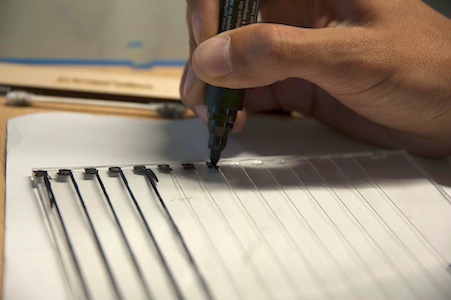
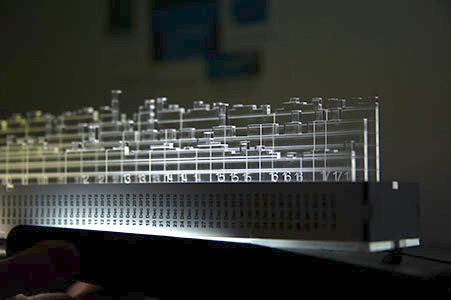
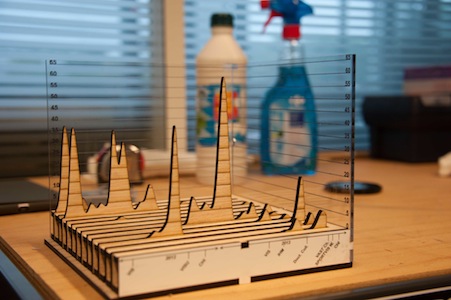
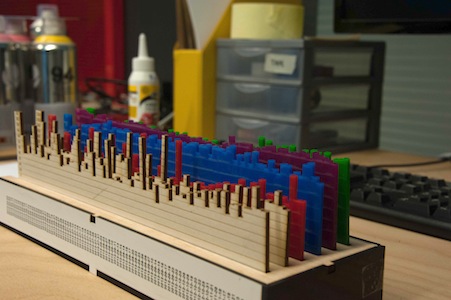
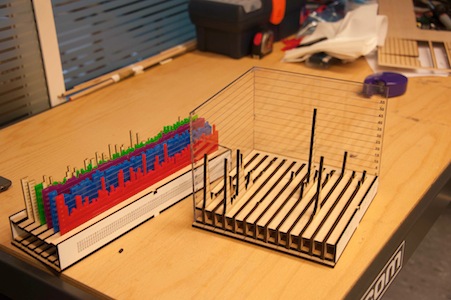
Photos from the Design Sessions
 |  |
 |  |
 |  |
 |  |
 |  |
 |  |
 |  |
 |  |
 |  |