Assessing the Effect of Visualizations on Bayesian Reasoning through Crowdsourcing
People have difficulty understanding uncertain information and are unaware of their wrong judgments, particularly in Bayesian reasoning (see video below for an example). We ran a study where a textual and six visual representations for three classic problems were compared through crowdsourcing. In contrast with most lab studies, crowdsourcing experiments involve a diverse population where participants do not devote an unrealistically high amount of cognitive resources to solve problems. Our study failed to replicate previous findings in that subjects’ accuracy was remarkably lower than in lab studies and visualizations exhibited no measurable benefit. A second experiment confirmed that simply adding a visualization to a textual Bayesian problem is of little help to crowdsource workers, even when the text explicitly refers to the visualization. The experiment however shows that visualizations are more effective when no numerical value is provided, suggesting that rough visual estimates can be more accurate than exact calculations, when these calculations are likely to be wrong.
The material available here is being ported to https://osf.io/68ntk/.
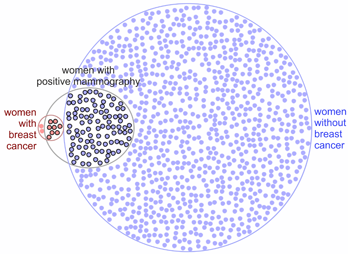
A Visual Explanation of the Mammography Problem
Click the image above to see a video with a visual explanation of the classic Bayesian mammography problem as presented at the IEEE VIS (formerly VisWeek) 2012 conference (note that our study only involved static visualizations without narratives).
Paper
Luana Micallef, Pierre Dragicevic and Jean-Daniel Fekete (2012): Assessing the Effect of Visualizations on Bayesian Reasoning through Crowdsourcing. IEEE Transactions on Visualization and Computer Graphics, 18(12): 2536-2545.
This work has been presented at IEEE InfoVis 2012, part of IEEE VIS (formerly VisWeek) 2012 conference, where it received a Best Paper Honourable Mention Award. Slides: 25 sec fast forward, 15 min presentation.
Software
All diagrams for the study have been automatically generated with eulerGlyphs by Luana Micallef.
Experimental Stimuli
Preview Our Bayesian Problem Presentation Formats and Our MTurk HITs
External Link: preview webpage
At this webpage, you can preview the Bayesian problem presentations assessed in our study using different visualization types and text formats, and you can preview the MTurk HITs we devised and used for:
- Experiment 1 (comparison of visualizations),
- Qualitative Feedback (follow-up questionnaire of Experiment 1), and
- Experiment 2 (alternative text formats).
Source Code of the MTurk External HIT Templates
Download file: SourceCodeOfMTurkExternalHITTemplates_MicallefEtAl.zip
This zip file contains three directories with the source code of the MTurk external HIT templates devised for:
- Experiment 1 (comparison of visualizations),
- Qualitative Feedback (follow-up questionnaire of Experiment 1), and
- Experiment 2 (alternative text formats).
For any one of the templates to be used, the respective directory should be uploaded on a server and the URL of the webpage.html file that is found in the directory should be included in the MTurk HIT Properties File, which we discuss in the next sub-section Managing the MTurk External HITs.
Managing the MTurk External HITs
Download file: ManagingExternalHITs_MicallefEtAl2012.zip
This zip file comprises:
- directory MTurkFilesDefiningTheHITs_Exp1Eg,
- containing an example from our Experiment 1 of the Question Template File, Input File and the HIT Properties File, which are the MTurk files that respectively define the URL of the external HIT template, the data to be placed in the HIT template and the properties of the HITs to be loaded into MTurk;
- directory MTurkOperations,
- containing the script files with the MTurk operations to load the HITs, get the results, review the results and delete the HITs.
- file Instructions.txt,
- with instructions on how to use the files provided in the above two directories to load the HITs into MTurk and manage them.
Refer to the MTurk User Guide for further details about the MTurk files defining the HITs to be loaded and the MTurk operations to manage the HITs.
Note
To reuse or adapt any of this material, please refer to the Licence section on this webpage. If you have questions, feel free to e-mail us.
Experimental Data
Download file: ExperimentalData_MicallefEtAl2012.zip
This zip file contains:
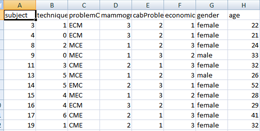
- Experiment1_MicallefEtAl2012.csv,
- the data obtained from the MTurk HITs in Experiment 1,
- which assessed the effect of visualization types V0, V1, V2, V3, V4, V5 and V6 on Bayesian problems Mam, Cab and Eco;
- the data obtained from the MTurk HITs in Experiment 1,
- QualitativeFeedback_MicallefEtAl2012.csv,
- the data obtained from the MTurk HITs of the follow-up questionnaire,
- which participants of Experiment 1 were requested to complete to determine whether they referred to the visualizations and whether they found them helpful;
- the data obtained from the MTurk HITs of the follow-up questionnaire,
- Experiment2_MicallefEtAl2012.csv,
- the data obtained from the MTurk HITs in Experiment 2,
- which assessed the effect of presentation types V0, V4, V4a and V4b on Bayesian problem Mam.
- the data obtained from the MTurk HITs in Experiment 2,
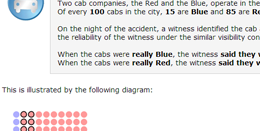
Refer to our paper for further details about the visualization types (V0, V1, V2, V3, V4, V5 and V6), the presentation types (V0, V4, V4a and V4b) and the Bayesian problems (Mam, Cab and Eco) assessed in this study.
To reuse or adapt any of this material, please refer to the Licence section on this webpage. If you have questions, feel free to e-mail us.
Licence
 | All material on this page is CC-BY-SA. Please cite our article and/or provide a link to this page whenever you reuse or adapt any of this material. |
Contact
- Luana Micallef - INRIA and University of Kent, UK
- Pierre Dragicevic - INRIA
- Jean-Daniel Fekete - INRIA