SEVEN: An Inria and Calgary Associated Team on Situated and Embedded Visualization ENvironments
The goal of this joint work between the Aviz team at Inria Saclay and the ILab at the University of Calgary is to develop and study situated data visualizations to address the limitations of traditional platforms of data analytics. In a situated data visualization, the data is directly visualized next to the physical space, object, or person it refers to. Situated data visualizations can surface information in the physical environment and allow viewers to interpret data in-context, monitor changes over time, make decisions, and act on the physical world in response to the insights gained. However, research on this topic remains scarce and limited in scope. We will build on our track record of successful collaborations to jointly develop situated visualization as a novel research direction.
Team Members
Inria and Calgary Team Members
| Inria | Expertise | Calgary | Expertise | ||
 | Petra Isenberg (PI) | Collaborative visualization, evaluation, novel devices |  | Wesley Willett (PI) | Personal analytics, crowdsourcing |
 | Tobias Isenberg | Scientific visualization, sensors and smart home, touch & tangibles |  | Carmen Hull | Simultaneous Worlds |
 | Pierre Dragicevic | Data physicalization, statistics, decision making |  | Lora Oehlberg | Digital fabrication, HCI, engineering design |
 | Jean-Daniel Fekete | Visual Analytics, Big Data, Networks |  | Kendra Wannamaker | Data entry for situated visualization |
| Lijie Yao | Situated visualizations in motion | | Xinchi Zhang | Planning and time management via situated visualization |
| Alaul Islam | Situated visualization for fitness trackers | | Nathalie Bressa | Situated visualizations for personal data analysis |
| Simon Fraser University | |||||
 | Sheelagh Carpendale | Visualization design, novel technologies, personal analytics | |||
 | Bon Adriel Aseniero | Situating vis in public spaces | |||
 | Katherine Currier | Situated visualization in the home | |||
| Faroozan Daneshzand | Situated visualization and architecture | |||
External Collaborators
 | Yvonne Jansen | Data physicalization, situated visualization, fabrication |
| Anastasia Bezerianos | Visualizations on mobile and micro visualizations |
Alumni
 | Mina Alipour | Situated visualization for health in the office | Inria Year 1 |
| Mathieu Louvet | Situated visualization for health in the office | Inria Year 1 |
| Tiffany Way Wun | Personal data analysis | Calgary Year 1 |
 | Ranjini Aravind | Situated visualization for sleep monitoring | Inria Year 2 |
Year 1
Objective
The objective for the first year was to design and implement situated visualizations to support health and aging.
Activities
Work has begun by two Master's student, Mina and Mathieu. Mina is a student from CentraleSupelec who joined Aviz to work on situated visualizations of noise in the office. Mathieu is a student from Polytech Paris Sud who works on situated visualizations of temperature data in a large open shared office.
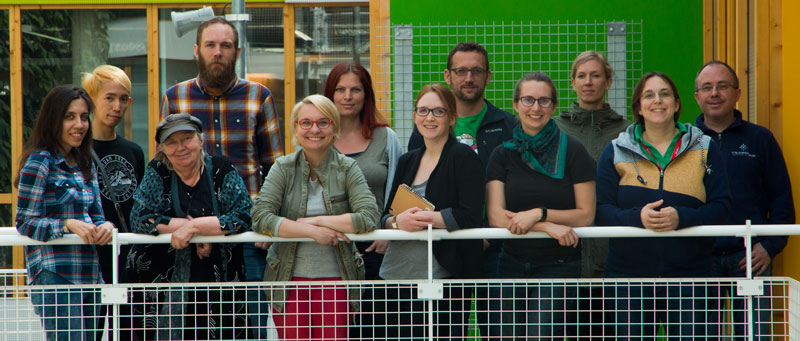
In addition to these two specific projects we meet for an inaugural workshop at the Aviz Fablab workspace in Gif Sur Yvette from May 14 - May 18. The purpose of the workshop was to identify open research topics and avenues for specific collaborations. The brainstorming activities were led jointly by Inria and Calgary team members. We also had a one-day workshop on smart-home sensors and programming infrastructure led by Tobias Isenberg.
In October we then met for a half day workshop in Berlin after the IEEE VIS conference. We discussed ongoing and future projects and the plan for the year 2 of our joint team.
Outcomes
- IEEE VIS Poster: Situated Visualizations of Office Noise to Promote Personal Health: Mina Alipour, Pierre Dragicevic, Tobias Isenberg, Petra Isenberg. Posters of the IEEE Conference on Information Visualization (InfoVis), 2018.
- EEE VIS Poster: Simultaneous Worlds: Using Physical Models to Contextualize and Compose Visualizations. Carmen Hull, Sheelagh Carpendale, Wesley Willett. Posters of the IEEE Conference on
Information Visualization (InfoVis), 2018.
- Master's Thesis: Mina Alipour
- Master's Thesis: Mathieu Louvet
Year 2
Objective
The objective for the second year was to design and implement situated visualizations for smart environments more broadly. That is, environments equipped with sensors that deliver data on the environment.
Activities
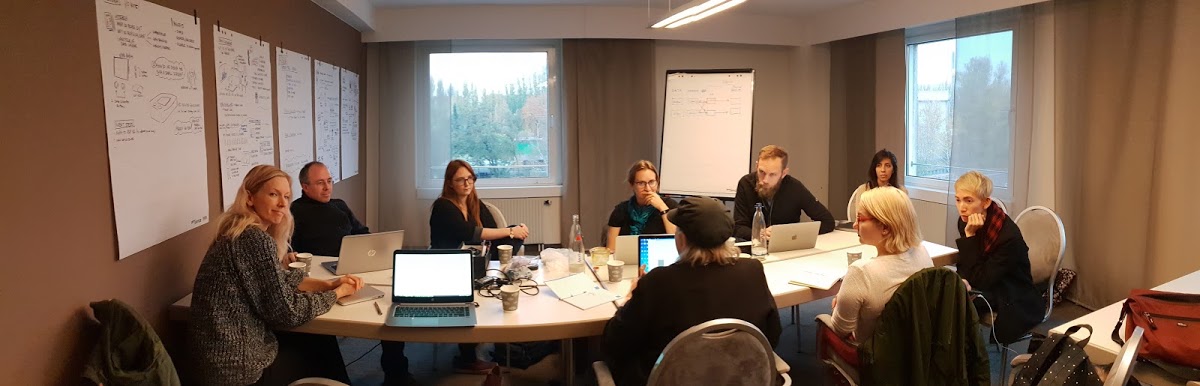
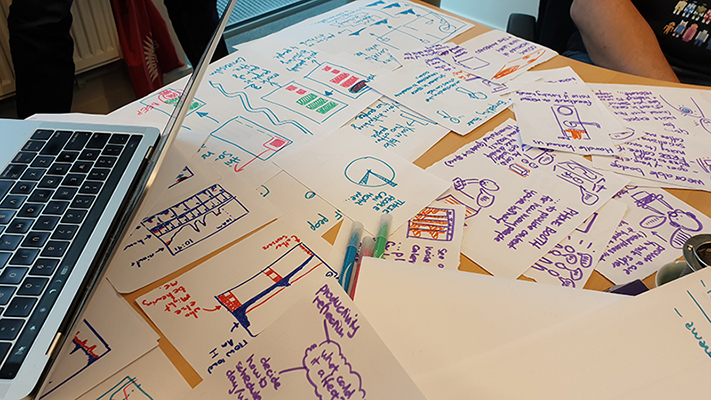
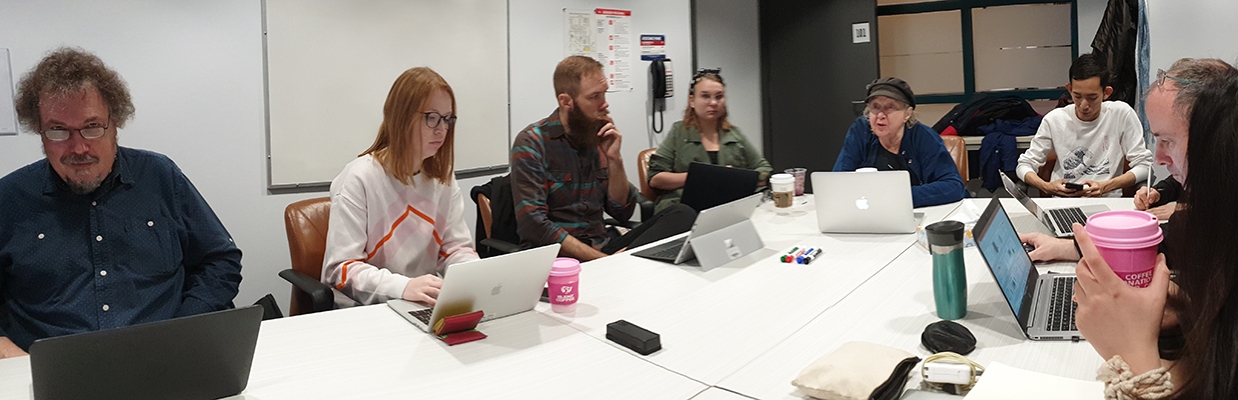
We continued work on health indicators for larger office environments and focused in particular on pushing the project related to noise detection further. In June both Wesley Willett and Lora Oehlberg came for a three-day workshop to Aviz during which we discussed designs for the noise project sensors and the associated data displays. We also worked in more depth on a survey article we plan to publish.
 |  |
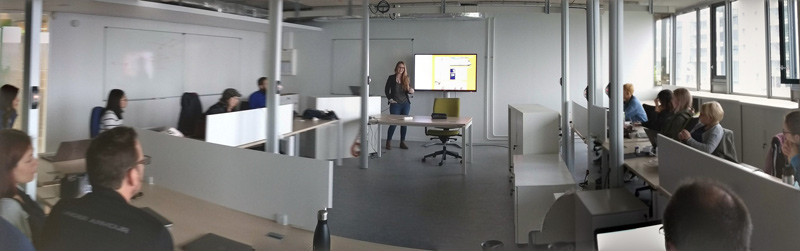
In October 2019 several team members met in Vancouver after the IEEE VIS conference for a 2-day workshop held at Simon Fraser University. During the meeting students and senior researchers gave overviews of projects and project progress to give us an overview of all activities of the associated team. In addition we brainstormed ideas to expand on ongoing projects and discussed future collaborations.
 | 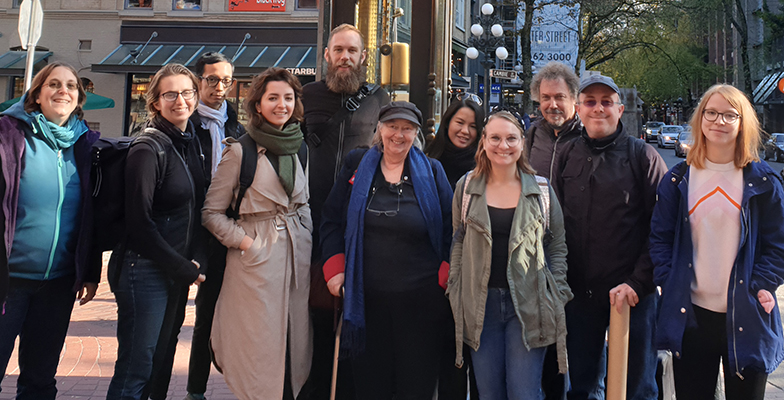 |
Outcomes
- IEEE VIS Poster: Situated Visualizations of Office Noise to Promote Personal Health: Mina Alipour, Pierre Dragicevic, Tobias Isenberg, Petra Isenberg. Posters of the IEEE Conference on Information Visualization (InfoVis), 2018.
- IEEE VIS Poster: Simultaneous Worlds: Using Physical Models to Contextualize and Compose Visualizations. Carmen Hull, Sheelagh Carpendale, Wesley Willett. Posters of the IEEE Conference on Information Visualization (InfoVis), 2018.
- Master's Thesis: Mina Alipour
- Master's Thesis: Mathieu Louvet
Year 3
Objective
The objective for the last year was to finish our started projects on office health and begin a new project related to situated visualizations in motion. Situated visualizations are often useful in contexts in which the data referent, the visualization, the data, or observer does not remain static but is moving at various speeds. Imagine, for example, displays attached to an athlete or animal that show data about the wearer -- for example, captured from a fitness tracking band; or a visualization attached to a moving object such as a vehicle or a soccer ball. In these mobile and dynamic use cases, situated visualizations have to overcome new challenges if we want the data to be readable in real-time by the human observer.
Activities
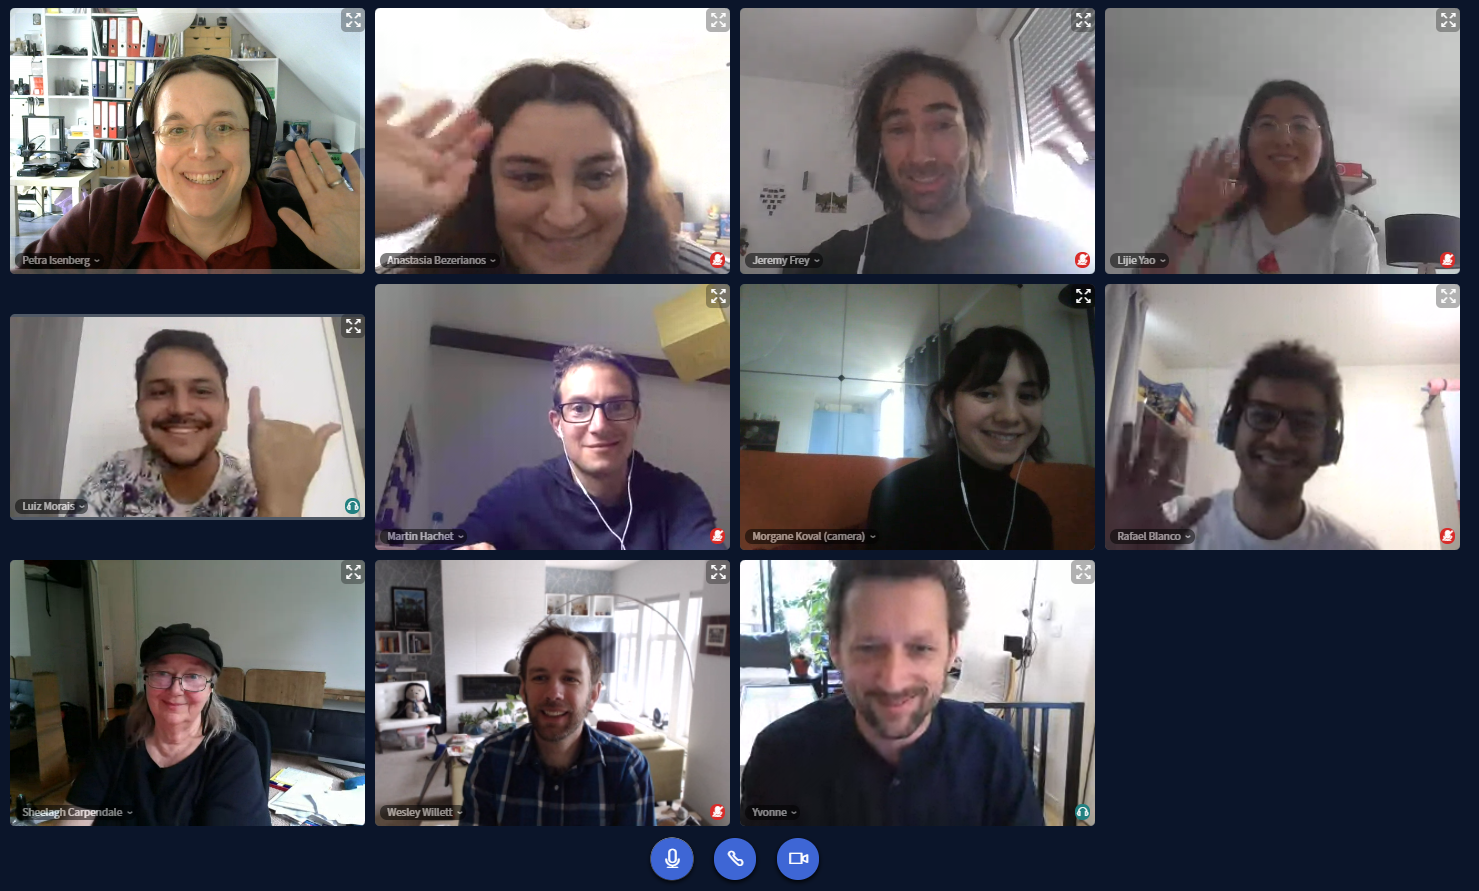
The pandemic has extremely derailed our work in the last year of the team. We had planned 3 research exchanges, one visit in Calgary, one visit by Calgary researchers at Aviz, and one Calgary student visiting Aviz. In addition the two Calgary researchers went on a 6 month paternity leave (congratulations on the new earthling!). We plan to, however, continue and finish our projects in 2021 in particular as part of the on which our Calgary partners are specifically going to collaborate. Sheelagh Carpendale came for a short visit this year to discuss the review article we are still working in. In addition, we all met online as part of the Ember kickoff event.
In summary, the associated team has been a great catalyst for our work on this topic. We have made clear progress, have engaged a community of students, and plan to collaborate in the future making further impact to the Visualization community. As such, thank you Inria for giving us the opportunity to meet and work closely on this exciting topic!
Outcomes for the 3 years of the team
Joint Publications:
- Perception! Immersion! Empowerment! Superpowers as Inspiration for Visualization. Wesley Willett, Bon Adriel Aseniero, Sheelagh Carpendale, Pierre Dragicevic, Yvonne Jansen, Lora Oehlberg, Petra Isenberg. IEEE Transactions on Visualization and Computer Graphics, Institute of Electrical and Electronics Engineers, 2022 (https://doi.org/10.1109/TVCG.2021.3114844⟩. Received a best paper award at IEEE VIS 2021.
- Mobile Visualization Design : An Ideation Method to Try. Sheelagh Carpendale, Petra Isenberg, Charles Perin, Tanja Blascheck, Foroozan Daneshzand, Alaul Islam, Katherine Currier, Peter Buk, Victor Cheung, Lien Quach, Laton Vermette. In : Mobile Data Visualization. Editors : Bongshin Lee, Eun Kyoung Choe, Petra Isenberg, Raimund Dachselt. CRC Press. 2021 – to appear.
- Situated Visualization in Motion. Lijie Yao, Anastasia Bezerianos, Petra Isenberg. Posters of the IEEE Conference on Visualization (VIS), Oct 2020, Salt Lake City, United States. 2020
- Interaction Techniques for Visual Exploration Using Embedded Word-Scale Visualizations. Pascal Goffin, Petra Isenberg, Tanja Blascheck, Wesley Willett. CHI 2020 - ACM Conference on Human Factors in Computing Systems, 2020, ⟨https://doi.org/10.1145/3313831.3376842⟩
- A Survey on Sleep Visualizations for Fitness Trackers. Ranjini Aravind, Tanja Blascheck, Petra Isenberg. Posters of the European Conference on Visualization (EuroVis), 2019, Porto, Portugal
- Situated Visualizations of Office Noise to Promote Personal Health. Mina Alipour, Pierre Dragicevic, Tobias Isenberg, Petra Isenberg. Posters of the IEEE Conference on Information Visualization (InfoVis), 2018.
- Situated Analytics Bruce Thomas, Gregory Welch, Pierre Dragicevic, Niklas Elmqvist, Pourang Irani, Yvonne Jansen, Dieter Schmalstieg, Aurélien Tabard, Neven Elsayed, Ross Smith, Wesley Willett Immersive Analytics, 11190, Springer, pp.185-220, 2018, Lecture Notes in Computer Science, ⟨https://doi.org/10.1007/978-3-030-01388-2_7⟩
Master theses
- Master thesis: Lijie Yao
- Master thesis: Ranjini Aravind
- Master thesis: Mathieu Louvet
- Master thesis: Mina Alipour
- Master thesis: Rafael Blanco
Grants
- ANR grant: EMBER - Situated Visualizations for Everyday Personal Analytics. Participants: Pierre Dragicevic, Petra Isenberg, Yvonne Jansen, Martin Hachet. With planned collaborations with Wesley Willett and Lora Oehlberg.
- ANR PRCI grant: MircoVis - Micro visualizations for pervasive and mobile data exploration. Participants: Petra Isenberg with collaborations planned with Wesley Willett and Sheelagh Carpendale.
Demos and Videos
- Situated Visualization in Motion, 30s fast forward video for VIS 2020 poster publication:
- Situated Visualizations of Office Noise to Promote Personal Health - VIS 2018 poster, 30s preview
- A Survey of Sleep Visualizations for Fitness Trackers – 30s EuroVis 2019 Poster Fast Forward