|
Immersive Analytics is a new multidisciplinary initiative to explore future interaction technologies for data analytics. Immersive Analytics aims to bring together researchers in Information Visualisation, Visual Analytics, Virtual and Augmented Reality and Natural User Interfaces. Call for papersDue to the recent advances in immersive technologies (VR, AR, large displays, tangible surfaces, etc.), we see new opportunities to using these technologies to analyse and explore data. Visual analytics is concerned with analytical reasoning facilitated by interactive visual interfaces. This definition is agnostic of the actual interface devices employed by visual analysis systems. Nevertheless, the affordances of the display and input devices used for analyzing data strongly affect the experience of the users of such systems, and so, their degree of engagement and productivity. However, a systematic approach to developing visual analytic tools that move beyond the desktop is yet lacking. In this call, we are looking for innovative research, design, and view-points, mature or work-in-progress, that fall into or are related to the following topics: Real-world VA/AR, Collaboration, Hybrid 2D/3D, Affordances for Immersion, Changing Technologies, Application Areas, Platforms and Toolkits. We call this new research thrust ``Immersive Analytics", a topic that will explore the applicability and development of emerging user-interface technologies for creating more engaging experiences and seamless work-flows for data analysis applications. More info here. |
#immersive2017 Tweets |
Accepted Papers
-
Immersive Analytics of Dimensionally-Reduced Data Scatterplots
In this work, we evaluate the use of an HMD-based Immersive Analytics approach to explore multidimensional data. Our main hypothesis is that the benefits obtained, such as a more natural interaction and an egocentric view of the data, besides the stereopsis, will be able to compensate the typical downsides of three dimensional visualization, enabling a better comprehension of distances and outliers. This hypothesis was tested through a case study with roll call analysis, using dimensionally-reduced voting data from the Brazilian Chamber of Deputies. A user study was conducted to allow a comparative analysis between the desktop-based 2D, desktop-based 3D and HMD-based 3D approaches. Results indicate advantages in accuracy in a point classification task with respect to the original dataset, as well as in distance perception and outlier identification tasks with respect to the principal components being visualized. The proposed immersive framework was also well rated in terms of user perception, with the best scores for accuracy and engagement.
Talk slides -
Affordances of Input Modalities for Visual Data Exploration in Immersive Environments
There has been a consistent push towards exploring novel input, display, and feedback technologies for sensemaking from data. However, most visual analytical systems in the wild that go beyond a traditional desktop utilize commercial large displays with direct touch, since they require the least effort to adapt from the desktop/mouse setting. There is a plethora of device technologies that are yet to be tapped. Through this paper, we want to bring attention to available modalities for input for visual exploration within immersive display environments. These can be environments that contain multiple wall and floor displays, or projections to create immersion. We first isolate the low-level interaction tasks performed by a user based on a usage scenario for visual exploration. We focus on egocentric visual exploration in the immersive environments, and introduce input modalities that enable interactions directly between a human body and objects of interest on the interface without a mediator in the middle (e.g., a handheld smartphone). Based on this, we identify affordances of different input modalities---touch, speech, proxemics, gestures, gaze, and wearable---in terms of the interaction tasks from the envisioned scenario. Finally, we discuss how modalities can be combined to complement each other and leverage their advantages in the immersive environment. By doing so, this paper provides guidelines for new system developers to figure out the best input technologies for their immersive analytics applications.
-
Drawing into the AR-Canvas: Designing Embedded Visualizations for Augmented Reality
This paper introduces the notion of the augmented reality canvas (AR-canvas) for information visualization. Other than the traditional empty (white), rectangular, and flat-dimensional canvas in traditional information visualization, the AR-canvas describes the part of a viewer's field-of-view where information visualization is rendered with respect to visible and potentially invisible real world objects. The visual and spatial complexity of the AR-canvas requires rethinking how to design visualizations for augmented reality. Based on the example of a library exploration scenario, we describe the essential parts of the AR-canvas as well as dimensions for visualization design. We conclude with a brief discussion of challenges in designing visualizations for the AR-canvas.
-
Take a Walk: Evaluating Movement Types for Data Visualization in Immersive Virtual Reality
3D virtual reality (VR) technology has long promised to provide new ways to view and interact with abstract data, but it has been held back by technological limitations and the difficulty of moving through 3D environments. Recent innovations in VR technology overcome previous constraints, but existing research has had mixed insights into the optimal types of virtual movement for task performance. We conducted a two-factor between subjects (N = 20) pilot experiment testing two types of viewpoint interaction for exploring a 3D scatterplot in a virtual environment developed using consumer-grade VR hardware and software tools. In one condition users changed their viewpoint by physically walking around the 3D scatterplot, the system matching their physical location to their virtual one. In the other users stood still and rotated the scatterplot with a controller. An exploratory analysis revealed that individual differences played a strong role depending on the condition. In particular, low spatial ability users were better supported by walking interaction rather than interaction using a controller. The pilot experiment revealed potentials for improvements in the chosen measures, and the findings will inform the design of future larger-scale evaluations.
-
VisAR: Bringing Interactivity to Static Data Visualizations through Augmented Reality
Static visualizations have analytic and expressive value. However, many interactive tasks cannot be completed using static visualizations. As datasets grow in size and complexity, static visualizations start losing their analytic and expressive power for interactive data exploration. Despite this limitation of static visualizations, there are still many cases where visualizations are limited to being static (e.g., visualizations on presentation slides or posters). We believe in many of these cases, static visualizations will benefit from allowing users to perform interactive tasks on them. Inspired by the introduction of numerous commercial personal augmented reality (AR) devices, we propose an AR solution that allows interactive data exploration of datasets on static visualizations. In particular, we present a prototype system named VisAR that uses the Microsoft Hololens to enable users to complete interactive tasks on static visualizations.
-
More Than Blips on the Radar: Exploring Immersive Visualization for Maritime Decision Making
Decision making in the maritime scenario is supported by large amounts of data from several different sources such as internal source, friendlies in the region and ground stations. On-board data specialists use computer-aided methods to interpret the data and to provide pertinent information for decision makers. Immersive Analytics can help specialists to explore the data more efficiently. However, current interaction techniques are a limitation to both exploration and adoption. This work discusses current research goals on interaction methodologies for mixed reality immersive visualization for collaborative work. We have created a simple prototype that allows users to collaborate in an immersive environment using multiple HoloLens and a projection mapped tabletop. At the current stage, users can join the augmented reality session (with position and orientation tracking) and visually explore the data.
-
Immersive Urban Analytics through Exploded Views
Recent years have witnessed the rapid development and wide adoption of immersive head-mounted devices, such as HTC VIVE, Oculus Rift, and Microsoft HoloLens. These immersive devices have native support for displaying 3D models in an immersive environment. The capability has the potential to significantly extend the methodology of urban visual analytics by providing critical 3D context information and creating a sense of presence. However, 3D city models may cause severe occlusion problems, blocking the path toward enabling immersive urban analytics. This paper presents a novel technique to create an exploded view in immersive environments. The 3D models are firstly exploded and grouped into layers. Then we formulate and solve a nonlinear least squares optimization problem to ensure the visibility, compactness, and alignment of all layers. Different from existing methods, our method is tailored to analyze urban data in immersive environments. We further conduct experiments to compare our method with two different methods and exam our method in various situations based on the HoloLens platform.
-
Immersive Visual Analytics for Modular Factory Layout Planning
To cope with the increasing demand for customized products, manufacturing processes become more adaptive and flexible, for example by using layouts that can be easily rearranged to adapt an assembly process with respect to the produced items. Specialized layout planning software is used to manage the multitude of possible arrangements and their effects in the production pipeline. However, not all conditions and dependencies can be tracked, modeled, and correctly interpreted in the virtual setup, making it challenging for domain experts to foresee real-world effects. To address this challenge, we contribute an immersive analytics approach that extends an existing factory layout planning tool. It employs augmented reality technology to superimpose existing setups and facilities for a more lifelike impression on production line layouts. The interactive planning is enhanced by automated layout suggestions using a genetic algorithm as well as automated layout comparison. A case study demonstrates the applicability in a realistic scenario.
-
Synthetic Visualizations in Web-based Mixed Reality
The way we interact with computers is constantly evolving, with technologies like Mixed/Augmented Reality (MR/AR) and the Internet of Things (IoT) set to change our perception of informational and physical space. In parallel, interest for interacting with data in new ways is driving the investigation of the synergy of these domains with data visualization. We are seeking new ways to contextualize, visualize, interact-with and interpret our data. In this paper we present the notion of Synthetic Visualizations, which enable us to visualize data superimposed in situ, on the physical world, using MR. We use a combination of established ‘markers', such as Quick Response Codes (QR Codes), Augmented Reality Markers (AR Markers), and graphically visualize the embedded data in Mixed Reality (MR), using emerging web-technologies and open-standards. We not only use the markers to register objects on the real-world, but they also contain the data to be visualized and determine the type of visualization to be used.
-
buenoSDIAs: Supporting Desktop Immersive Analytics While Actively Preventing Cybersickness
Immersive data analytics as an emerging research topic in scientific and information visualization has recently been brought back into the focus due to the emergence of low-cost consumer virtual reality hardware. Previous research has shown the positive impact of immersive visualization on data analytics workflows, but in most cases insights were based on large-screen setups. In contrast, less research focuses on a close integration of immersive technology into existing, i.e., desktop-based data analytics workflows. This implies specific requirements regarding the usability of such systems, which include, i.e., the prevention of cybersickness. In this work, we present a prototypical application, which offers a first set of tools and addresses major challenges for a fully immersive data analytics setting in which the user is sitting at a desktop. In particular, we address the problem of cybersickness by integrating prevention strategies combined with individualized user profiles to maximize time of use.
-
I-Flight: Immersive Visual Analysis of Insect Flight Behaviour
We present I-Flight, a virtual reality based visual analysis system for insect movement data. I-Flight aids in understanding insect movements and collective flight behaviour in a simulated environment. Towards this end, I-Flight visualises insect flight paths in their natural, 3D geo-spatial context. In this paper, we demonstrate the use of I-Flight for honey bee flight data and related environmental variables. The system is designed to be extendible to other insect flight data by adopting the data attribute space and the respective mapping onto visual variables, such as colours. The value of the presented I-Flight system is not only in complementing existing scientific methods and tools for understanding honey bee behaviour, but also in raising broader awareness for honey bee preservation through an engaging, immersive environment.
-
Medical Image Atlas Interaction in Virtual Reality
Medical image atlases provide a wealth of information about the anatomy of organisms, but understanding the shapes of regions and the overall hierarchical structure of an atlas can be difficult. Atlases can contain hundreds of regions with complex shapes. The way those shapes fit together is difficult to visualize because they are usually packed tightly together and occlude each other. In this work we describe a technique which enables interactive exploration of medical image atlases and an underlying medical image by creating exploded views similar to those used in technical illustrations to enhance the visualization of mechanical assemblies. A pair of motion tracked controllers allow the user to intuitively control the process of exploded view generation.
Accepted Posters
-
Multiple Views in Immersive Analytics
We consider the challenges and potentials for multiple views when applied in immersive analytics. The changes in physical setup of very large and possibly multiple displays, potentially combined with smaller handheld displays that can be used for both input and display augmentation, in addition to new input technologies, challenges much of current practice in multiple views. In particular: coordination techniques need to be extended for multiple views across multiple displays; we may need to re-examine task and interaction behaviour in new environments; given the potential for multiple display environments to provide more space for team analytics, collaboration challenges may come to the fore; and re-considering our formalisms in light of all these changes may prove fruitful.
-
Immersive Applications for Informal and Interactive Learning for Earth Sciences
Immersive technologies provide novel ways to integrate data with their context. This integration has brought tremendous opportunities to blur the distinction between classroom-based formal learning and informal learning in the outside world. Additionally, the ability for virtual navigation to real world sites has converged space and time. To further the understanding of such opportunities, this paper presents an ongoing project that integrates heterogeneous datasets (i.e., tabular data, 360° photos, and videos) with the 3D photorealistic model of a real-word object in a comprehensive suite of immersive applications (i.e., virtual and augmented reality, collectively known as xR). Our xR prototype provides an immersive analytical environment that supports interactive data visualization and virtual navigation in a natural environment. This work-in-progress project can provide an interactive immersive learning platform (specifically, for K-12 and introductory level geosciences students) where learning process is enhanced through seamless navigation between 3D data space and physical space.
-
Immersive Analytics for Clinical Neuroscience
This paper introduces NeuroCave, an immersive analytics software tool for exploring and making sense of both structural and functional connectomes describing the interconnectivity between brain regions. The software supports visual analysis tasks for clinical neuroscientists, facilitating explorations of connectome datasets used in comparative group studies. Users can enter and leave virtual reality as desired in order to visualize and reason about connectome datasets from a range of different perspectives.
-
The rapid advance of handheld and head-mounted mixed reality technologies comes with many opportunities to integrate 3D visualizations on top of screen-based 2D technologies for immersive analytics, such as the ability to walk through particle data. However, while mixed reality devices can render virtual worlds into the three dimensional space of the physical world, integrating these devices with 2D immersive technologies is fundamentally constrained by the limited computing and networking resources of energy-efficient mobile devices. Towards a better understanding of these limitations, we design and implement a distributed particle rendering framework to bridge mobile mixed-reality devices with an immersive screen-based stage environment using a Microsoft HoloLens, an NVIDIA Shield Tablet, and a multi-projector immersive data visualization environment. Using our framework, we characterize rendering and networking constraints of the devices involved in the hybrid data visualization. We propose strategies to operate within these constraints to provide rich immersive 3D visualizations through dynamic partitioning and selective rendering of data-visualization workloads across 2D and 3D devices.
-
Into the mixed reality data sphere: mapping user's movements to data exploration tools
In this paper, we propose to take advantage of user movements when exploring data in a virtual reality environment. As Human-Computer Interaction (HCI) relies on a fast and accurate binding between users actions and the system's responses, we explore using the user location, as measured by the HoloLens head tracking, for data exploration, leaving the user hands free for data manipulation and selection. Since HoloLens has a very accurate measurement of user's head movements, we investigated the available design space to efficiently map data exploration actions to these user head movements. To better investigate our design space, we implemented prototypes and explored new interaction techniques thanks to different data types and data exploration tasks.
-
Immersive Visualization of Big Data for River Disaster Management
We present a virtual reality visualisation of pre-recorded data from approximately 18,000 weather sensors placed across Japan. Utilising the HTC Vive and the Unity engine, we developed a novel visualisation that allows users to explore data from these sensors in both a global and local context. We also investigated a variety of methods for interaction using the Vive's motion controllers. The user is able to fly around the map, to open an interactive window for any sensor, and to seek their position in time throughout the month of recorded data.
-
Scientific data analysis is an inherently exploratory process that requires flexible human interaction with data visualization and analysis tools. In this paper, we describe challenges in neutron scattering data analysis and present our approach for allowing more effective human interaction. In addition to multi-touch enabled data visualization techniques, we describe color scale enhancements, layouts, and visual analytics approaches for 3D volume slicing. Since challenges in neutron science are echoed in most scientific fields, we generalize the project objective and present a case for bridging the gap between the latest advances in interactive data visualization and practical scientific scenarios where new critical knowledge is buried in large volumes of complex data.
-
Structuring Human-ML Interaction With an Immersive Interface Based on Qualitative Coding
With ever increasing bodies of data, much of it unlabeled and from complex, dynamic and weakly structured domains, machine learning (ML) is more necessary than ever. Yet even domain experts have difficulty understanding most ML algorithms, and so cannot easily retrain them as new data arrives. This limits ML's use in many fields that sorely need it, such as law, where users must have confidence in ML results. Interactive machine learning techniques have been proposed to take advantage of humanity's ability to categorize in these complex domains, but little attention has been paid to building interfaces for non-ML experts to provide input, and in particular to creating a user experience that engenders trust. Qualitative coding - the decades-old practice of manual classification - provides a proven methodology that can be adapted to structure interaction between domain experts and ML algorithms. Qualitative coders often use physical props such as notecards to help sort through and understand datasets. Here we explore how an immersive system can be built to leverage QC's intuitive techniques and grow a trusting partnership between human and ML classifiers.
-
Exploring the Use of Heuristics for Evaluation of an Immersive Analytic System
Heuristics are a discount method for expert evaluation of systems. They help to identify usability problems in and can serve as guidelines for design and development, pending more formal testing and evaluation. As a new field, immersive analytics has not yet developed a set of common-practices or guidelines that might be coalesced into heuristics designed specifically for the field. This paper reviews the Nielsen usability heuristics as a starting point for the evaluation of immersive analytic systems. We present GeoVisor, an immersive analytic system in virtual reality for geographic visualization and abstract visualization of data, and use it as the target of our evaluation. We find the majority of the Nielson heuristics provide useful insight into the issues we have encountered during GeoVisor's development. Tellingly, some of our current issues in GeoVisor revolve around areas where Nielsen's heuristics do not provide direct guidance. This indicates areas where these heuristics need to be modified to adapt to the development of immersive analytic systems, as well as areas for further research into abstract visualization of data in immersive environments.
-
We explore if and how immersive analytics, in particular AR and Sketch-Based Visualization, can be used to support the geologists' field workflow. Fieldwork involves careful observations and measurements in the field, the collection of rock and fossil samples and the recording of complementary information for further analysis. In the field, the workflow comprises in-situ hand drawing of sketches through careful observation of the area to be explored and the incorporation of all the data that the geologist collect in the field to these drawings. This implies that a constant association of 2D (sketch)-3D (real environment) information is being carried out at all times, taking into account a previously defined scale of work. Our main goal is to support the field workflow integrating the real environment with an automatically generated sketch to facilitate the geologists´ fieldwork. Our system is based on an interactive AR approach on mobile devices. We evaluated the introduced approach using a real-life case study. User feedback and observations from our interdisciplinary team indicate the utility of the approach for the current case study as well as some shortcomings and areas for future research.
-
Immersive Navigation in Visualization Spaces through Swipe Gestures and Optimal Attribute Selection
Exploratory data analysis is an essential step in discovering patterns and relationships in data. However, the exploration may start without a clear conception about what attributes to pick or what visualizations to choose in order to develop an understanding of the data. In this work we aim to support the exploration process by automatically choosing attributes according to an information-theoretic measure and by providing a simple means of navigation through the space of visualizations. The system suggests data attributes to be visualized and the visualization's type and appearance. The user intuitively modifies these suggestions by performing swiping gestures on a tablet device. Attribute suggestions are based on the mutual information between multiple random variables (MMI). The results of a preliminary user study (N = 12 participants) show the applicability of MMI for guided exploratory data analysis and confirm the system's general usability (SUS score: 74).
-
Towards HMD-based Immersive Analytics
Advances in 3D hardware and software have led to increasingly cheaper and simple-to-use immersive virtual reality systems that can provide real-time interactive 3D data representation. The immersive analytics field is developing as the newest avatar of 3D visual analytics, which may relaunch the long enduring 2D vs 3D visualization debate. However, the terms of the debate have changed: leveraging 3D human perception within virtual environments is now easier, and the immersive quality of today's rendering is sufficient enough for researchers to concentrate on testing and designing immersive data representation and interaction rather than on technological problems. In this position paper we propose a short historical perspective on the use of immersive technologies for visual analytics and on the 2D vs 3D debate. We stress out five principles that we think should be followed to explore the enormous HMD-based visual analytics design space, before introducing our ongoing work within the IDEA project.
-
Gistualizer: An Immersive Glyph for Multidimensional Datapoints
Data from diverse workflows is often too complex for an adequate analysis without visualization. One kind of data are multi-dimensional datasets, which can be visualized via a wide array of techniques. For instance, glyphs can be used to visualize individual datapoints. However, glyphs need to be actively looked at to be comprehended. This work explores a novel approach towards visualizing a single datapoint, with the intention of increasing the user's awareness of it while they are looking at something else. The basic concept is to represent this point by a scene that surrounds the user in an immersive virtual environment. This idea is based on the observation that humans can extract low-detailed information, the so-called gist, from a scene nearly instantly (< 100 ms). We aim at providing a first step towards answering the question whether enough information can be encoded in the gist of a scene to represent a point in multi-dimensional space and if this information is helpful to the user's understanding of this space.
-
Reexamining the Cognitive Utility of 3D Visualizations using Augmented Reality Holograms
3D visualization has received considerable attention over the past few decades. Much extant research suggests 3D visualization is not beneficial except for a small number of specific scenarios. Studies suggest that drawbacks of 3D visualization are often due to presenting visualizations on a 2D display. Recent advances in augmented reality allow for the creation of holograms, which appear as 3D objects in the physical world. These advances offer new possibilities for displaying 3D visualizations in more realistic 3D forms. However, little research has examined these new possibilities. In this paper we discuss a work-in-progress project aimed at reexamining the cognitive utility of 3D visualizations when displayed as holograms in augmented reality. We describe a space-time cube prototype that is under development for the Microsoft HoloLens platform. We also outline plans for an experiment that will examine levels of cognitive engagement and types of cognitive processes while interacting with holograms compared to visualizations in traditional 2D displays. We reflect on some potential benefits of holographic projections displays for multidimensional visualizations.
Submission Info
The type of contributions can include, but is not limited to, the following:
- Descriptions of novel techniques.
- Systems supporting specific scenarios or workflows and variety of of visualizations and interaction techniques.
- Toolkits provide solutions for specific aspects in developing analysis systems for immersive environments or provide better integration.
- Studies and evaluations of all types both for gathering feedback on techniques and other aspects in immersive environments, such as context, tasks, devices challenges and interaction modalities, etc.
- Surveys of existing techniques, implementations, devices, modalities, for immersive visualization.
- Theory and models both new and adaptations of existing models to the immersive context.
- Positions and Reflections are encouraged to create a critical discourse on novel visualization and interaction technologies
Submissions can be of any length from 2 to 4 pages in standard IEEE TVCG format (conference), in proportion to the contribution: work-in-progress, latest breaking news, or mature research.
| Paper Submission deadline: | July 23, 2017 (midnight PDT) |
| Paper format: | IEEE TVCG, conference |
| Submission length: | 2 - 4 pages (including references) |
| Submission website: | http://precisionconference.com/~vgtc > new submissions > Submit to Immersive2017. |
| Review Process: | 3 peer reviews each. Single-blind mandatory, double-blind optional. |
| Presentation: | ~10 minutes at Workshop (depending on paper length). |
| Registration: | Participants must be registered at for the specific day at the VIS conference. |
| Final reviews: | ~August 16, 2017 |
Schedule
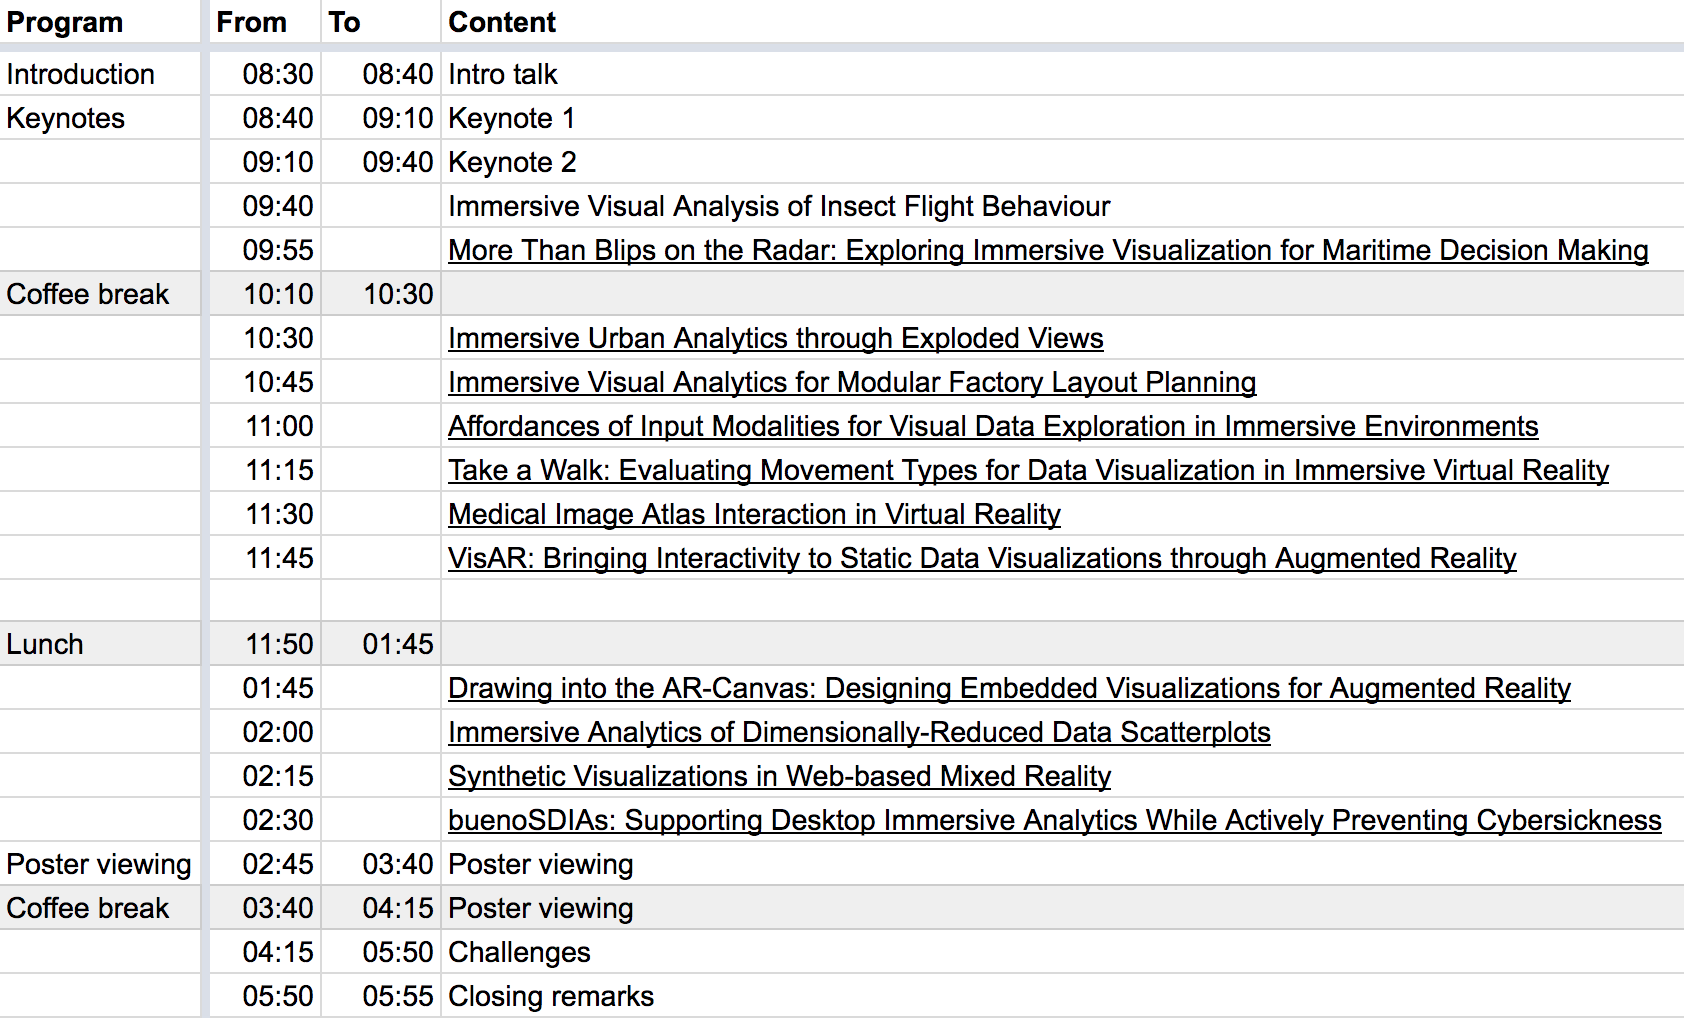
The workshop will be on Sunday, October 1 in 102-ABC.
If you want to join the group discussions, here is the link to the discussion/question form for the workshop.
 Keynote 1: Daniel Keefe: Experiential Analytics: From Large-Scale Public Art to Immersive Visualization---When to Walk Inside Your Data
Abstract: The technical barriers to immersion are all but gone today, but the question remains---is it a good idea to immersive yourself in data? I mean quite literally, does it ever actually make sense to stand inside a large-scale virtual (or physical) data visualization and walk through your data? In this short talk, I'll reflect on several recent immersive visualization projects by my group and our collaborators, some immersive virtual reality data visualizations as well as two large-scale public art installations. In each case, the special ingredient that makes each work as an example of immersive analytics is the need to not only analyze the data but also to experience it via a first-person perspective. Thus, I wonder if we should be calling immersive analytics something more like experiential analytics. How do we understand and design for this experience? How do we quantify it? When is it essential and for whom? Are there counter examples where it is unnecessary and slows down the analytical process? I hope this talk will inspire reflection and discussion on these topics and the exciting future of immersive analytics, as clearly evidenced by this year's workshop.
Bio: Dan Keefe is an Associate Professor in the Department of Computer Science and Engineering at the University of Minnesota. His research centers on scientific data visualization and interactive computer graphics. Keefe's recent awards include the National Science Foundation CAREER award; the University of Minnesota Guillermo E. Borja Award for research and scholarly accomplishments; the University of Minnesota McKnight Land-Grant Professorship; and the 3M Non-tenured Faculty Award. He shares multiple best paper awards with his students and collaborators, and his research has been funded by the National Science Foundation, the National Institutes of Health, the National Academies Keck Futures Initiative, the US Forest Service, and industry. In addition to his work in computer science, Keefe has also published and exhibited work in top international venues for digital art. Before joining the University of Minnesota, Keefe did post-doctoral work at Brown University jointly with the departments of Computer Science and Ecology and Evolutionary Biology and with the Rhode Island School of Design. He received the Ph.D. in 2007 from Brown University's Department of Computer Science and the B.S. in Computer Engineering summa cum laude from Tufts University in 1999.
Keynote 2: Niklas Elmqvist: Towards Ubiquitous Analytics: Reflections on Two Decades of Anytime, Anywhere Sensemaking ResearchAbstract: I was born 10 years too early, or at least, my Ph.D. research was. Fresh from a hobby career as a 3D game programmer, I entered research in 2001 with a burning desire to employ 3D graphics to data visualization. Unfortunately, at the time, VR and AR hardware was still not ready, and I eventually grew disillusioned of the fallacies of 3D on a 2D screen. We have come full circle, and the pendulum has swung back towards integrating visualization in 3D environments, but this time, the technology is there. In this talk, I will reflect on some of the hard-won lessons I have learned from this topic, starting from the 3Dwm window manager, my forays into 3D visualization and virtual environments, and my recent focus on what I call ubiquitous analytics: the ability to make sense of data anytime and anywhere.
Bio: Niklas Elmqvist is an associate professor in the iSchool (College of Information Studies) at University of Maryland, College Park. He received his Ph.D. in computer science in 2006 from Chalmers University in Gothenburg, Sweden. Since 2016, he is the director of the Human-Computer Interaction Laboratory (HCIL) at University of Maryland, one of the oldest and most well-known HCI research labs in the country. His research area is information visualization, human-computer interaction, and visual analytics. He is the recipient of an NSF CAREER award as well as best paper awards from the IEEE Information Visualization conference, the ACM CHI conference, the International Journal of Virtual Reality, and the ASME IDETC/CIE conference. He is papers co-chair for IEEE InfoVis 2017, associate editor of IEEE Transactions on Visualization and Computer Graphics, the International Journal of Human-Computer Studies, and the Information Visualization journal, and co-editor of the Morgan and Claypool Synthesis Lectures on Visualization. His research has been funded by both federal agencies such as NSF, NIH, and DHS as well as by companies such as Google, NVIDIA, and Microsoft. He is also the recipient of the Purdue Student Government Graduate Mentoring Award (2014), the Ruth and Joel Spira Outstanding Teacher Award (2012), and the Purdue ECE Chicago Alumni New Faculty award (2010).
Topics (Detail)
Changing Technologies and Scenarios: What are the lessons that we can learn from previous research into the use of 3D visualization for information visualization? Do the new technologies invalidate the current wisdom that it is better to use 2D visualization for abstract data since the designer of the visualization has complete freedom to map data to an occlusion-free 2D display? How do we perceive, interact, collaborate, annotate, communicate with visualizations in the forthcoming decades?
Hybrid2D/3D: Traditionally, 3D visualizations have been used in the physical sciences, engineering, and design while 2D visualizations have been used to display statistical and abstract data in information visualizations. Increasingly there is a need to combine both sorts of visualization in holistic visualizations. For instance, in the life sciences different aspects of a cell are displayed using 2- and 3D images, 2D network data and the various omics. Can these new technologies support more holistic visualizations of such data incorporating 3D spatial information as well as abstract data?
Affordances for Immersion: What are the "tricks" and affordances such as high-resolution displays, sound, touch, novel hard- ware and responsive interaction that change the user perception from an allocentric view of the data to a more egocentric and immersive view of the data?
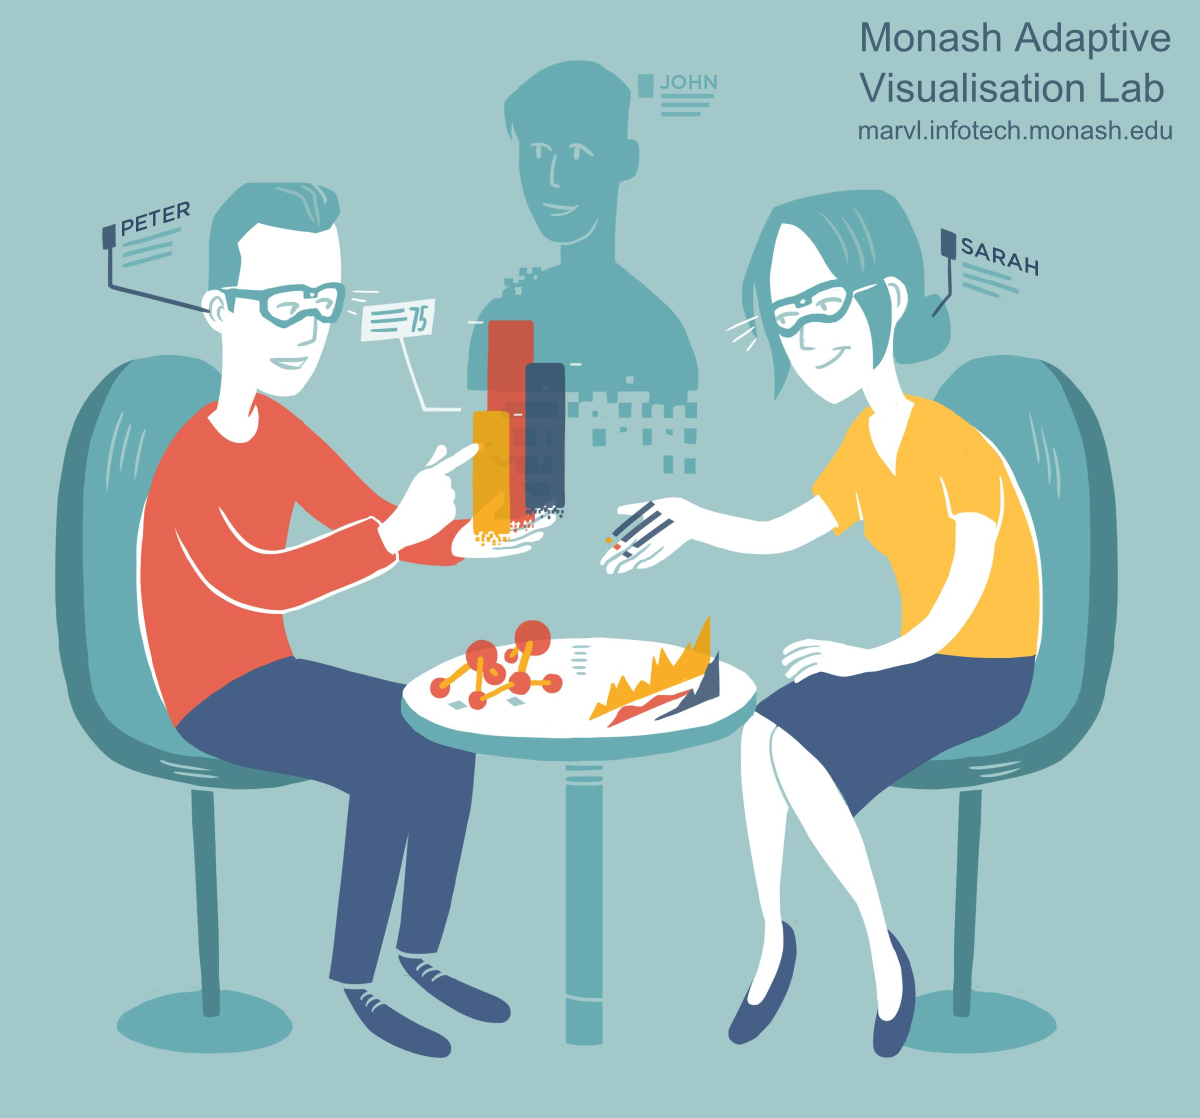
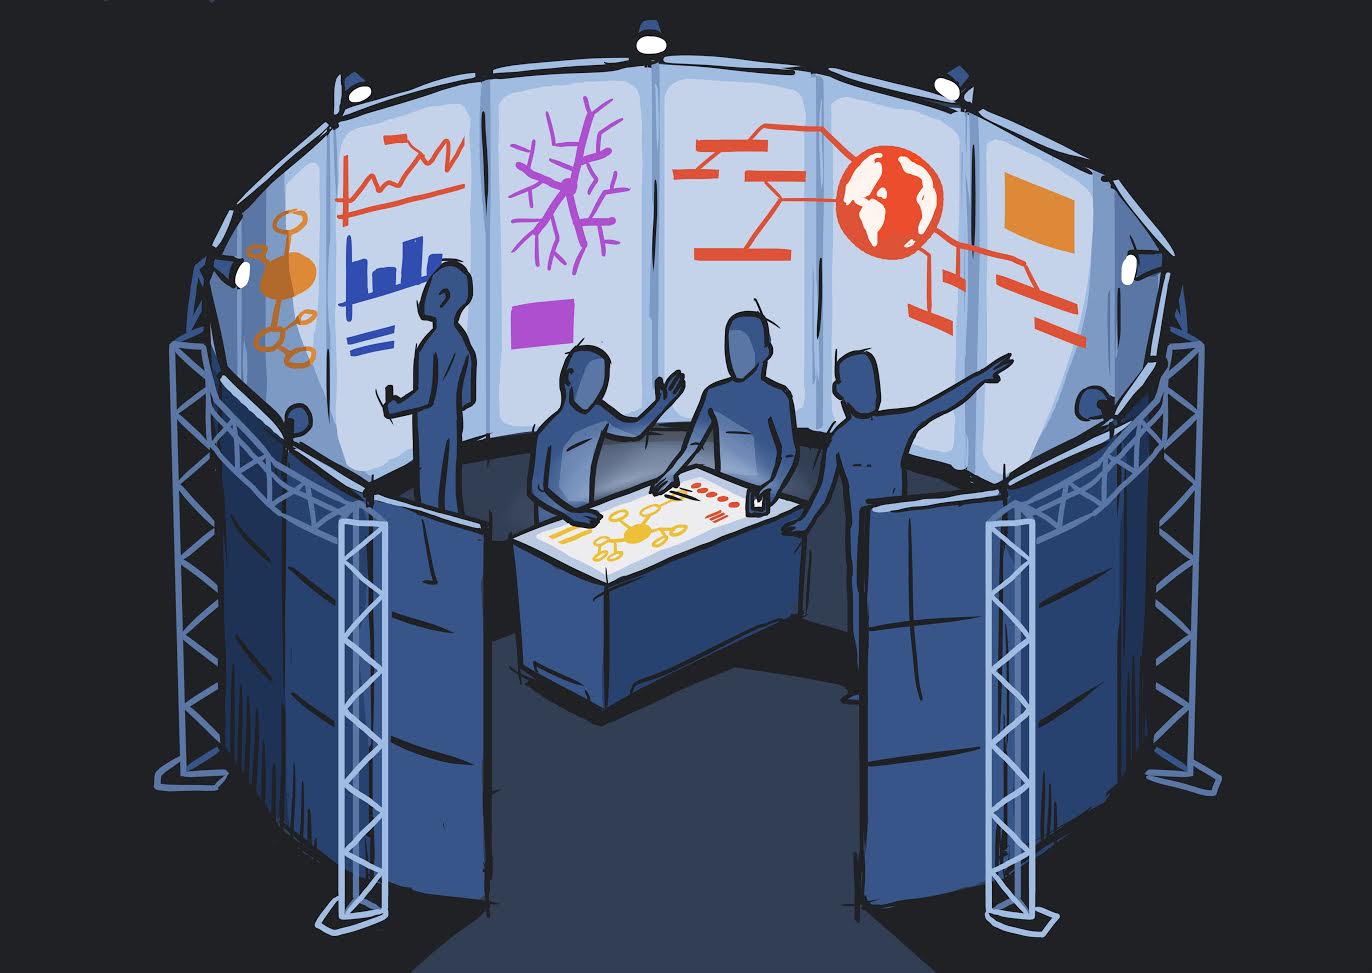
Collaboration: Much research has been devoted to computer- assisted collaboration both synchronous and asynchronous, local and remote. In contrast, only few research and formal user studies have investigated collaborative visualization of abstract data in immersive environments. The new devices and environments potentially support new models for collaboration as shown in Figure 1. Collaborative Immersive Analytics can be supported, for example, by CAVE-style environments, the use of Virtual Reality HMDs, or Mixed Reality HMDs. This heterogeneity of technology involves a lot of variation on the type of collaboration and raise important research questions. How do these different environments scale with increasing number of participants? What paradigms are potentially enabled by these new interaction modalities? Can new technology bring distant collaborators closer together?
Physical and Tangible Visualization: Being part of the real world for a long time, physicalizations and dynamic visualizations have become interactive through electronics, tactility, and fabrication mechanisms. How do data physicalizations integrate into immersive scenarios and with other immersive technologies?
Interaction Techniques: Which interaction and interface design advances are needed to foster a heightened sense of immersion? The interaction techniques incorporated in existing desktop-based visualization tools introduce interface elements such as menus and widgets that act as mediators between users and the visual representation. However, due to recent advances in immersive technologies, we envision the need for new interaction techniques and designs that support direct user involvement with visualization elements rather than communication through an intermediary. This ranges from the use of novel technologies to create these interactions, to augmenting existing UI designs to foster more engaging user experiences with traditional hardware.
Real-World VA and Applications: What are the most fertile application areas for visualization? For example, these could be in life-sciences, climate science, disaster and emergency management, astronomy, personal visualization, archeology, Air Traffic Control and Management, and many more. What questions do technologies like AR raise for visualization? Traditional information visualization supports open-ended exploration based on Shneiderman's information mantra: overview first, zoom and filter, then details on demand. In our view a different model is required for analytical applications grounded in the physical world. In this case objects in the physical environment provide the immediate and primary focus and so the natural model is to provide detailed information about these objects and only provide contextual information on demand.
PC Members
- Anastasia Bezerianos, University Paris-Sud / CNRS / Inria, France
- Doug A. Bowman, Virginia Tech, USA
- Wolfgang Bueschel, Dresden University of Technology, Germany
- Jian Chen, University of Maryland Baltimore, USA
- Steven Drucker, Microsoft Research, USA
- Carla Freitas, Federal University of Rio Grande do Sul, Brazil
- Nathalie Henry Riche, Microsoft Research, USA
- Christophe Hurter, ENAC, France
- Karsten Klein, Konstanz University, Germany
- Kim Marriott, Monash University, Australia
- Emmanuel Pietriga, Inria, France
- Eric Ragan, Texas A and M University, USA
- Gerik Scheuermann, University of Leipzig, Germany
- Falk Schreiber, Konstanz University, Germany
- Ronell Sicat, Harvard University, USA
- John Stasko, Georgia Tech, USA
- Wolfgang Stuerzlinger, Simon Fraser University, Canada
- Aurelien Tabard, University Claude Bernard, France
- Bruce Thomas, University of South Australia, Australia
- Aaron Quigley, University of Saint Andrews, UK
Reads: What happened since the workshop and outside
Cost-benefit Analysis of Visualization in Virtual Environments
arXiv, 2018
ImAxes: Immersive Axes as Embodied Affordances for Interactive Multivariate Data Visualisation
ACM UIST, 2017
The Hologram in My Hand: How Effective is Interactive Exploration of 3D Visualizations in Immersive Tangible Augmented Reality?
IEEE TVCG, 2018
Community
Below we list groups and projects interested in Immersive Analytics; feel free to contact them. If you want to be listed below as well, email us your tag:
- Immersive Analytics at Monash University, Australia (Tim Dwyer, Kim Marriott)
- PNNL, WA, USA (Nick Cramer)
- Workshop on Immersive Analytics at IEEE VR 2016 (March 2016)
- Immersive Analytics community site
- Dagstuhl seminar on on Immersive Analytics (June 2016)
- Immersive Analytics, position paper BDVA conference 2015.
- Image and Signal Processing Group, Leipzig University, Germany: We develop visual analysis methods and solutions for CFD, material science, bioinformatics, neuroscience, and digital humanities. Recently, we started using light-weight immersive technology like HTC Vive and Oculus Rift for immersive analytics. http://www.informatik.uni-leipzig.de/bsv/homepage/en
- Alexander Klippel, Department of Geography, Pennsylvania State University
- At the Interactive Media Lab Dresden we are researching Natural User Interfaces using very large displays in combination with mobile handheld surfaces for data exploration and information visualization. Tangible Displays, BodyLenses, Gaze, Multitouch and Embodied Interaction are novel means of exploring complex data. See our IMLD publication list.
- Interacting with Large Data (ILDA) at INRIA: we design and develop advanced interactive visual interfaces for ultra-high-resolution wall displays such as the WILD and WILDER platforms in Paris and ANDES in Santiago de Chile. We also work on software toolkits to develop visualization and interaction techniques for these cluster-driven wall displays.
- Immersive Analytics open developer community encourages building innovative use cases that apply immersive interaction technologies for data analytics. A focus is virtual data worlds using various approaches, such as PyData packages interacting with Unity3D rendering. A goal is to bridge IA efforts between academic and commercial interests. Contact editors@ImmersiveAnalytics.com (currently Richard Hackathorn & Todd Margolis).
- Immersive Analytics lab at the University of Konstanz' Life Science Informatics group
- http://viscenter.uncc.edu”>Charlotte Visualization Center (Isaac Cho, Zachary Wartell)