Class Project

We will work on a project in the domain of bibliometrics and specifically scientometrics. In scientometrics our goal is to measure and analyze -- and in our case also visualize and communicate science. As part of your project in this domain you will learn to read, wrangle, and visualize various data types; to design and create effective ways to represent and communicate data; to build an interactive graphical web tool; and to follow a research question and find answers to it.
As a first step you should familiarize yourself with a few concepts:
If you have any questions while reading these articles, please post them on Slack and I'll try to answer them for everyone.
Project Dataset
For the project we will use the https://vispubdata.org on all publications from the most prestigious visualization conference: IEEE Visualization (VIS in short). Please go to the https://vispubdata.org website to learn more about the columns that are available for you to analyze and to familiarize yourself with the naming history of the conference and it's 3 individual tracks.
In addition, download this data file which contains a row for each author, paper DOI, in which position in the author order they are for this paper, and in which rank (F=first author, M=somewhere in the middle, L=last author).
Research Questions
For your project you can select from the following research questions to work on:
1) Supporting Peer-Review
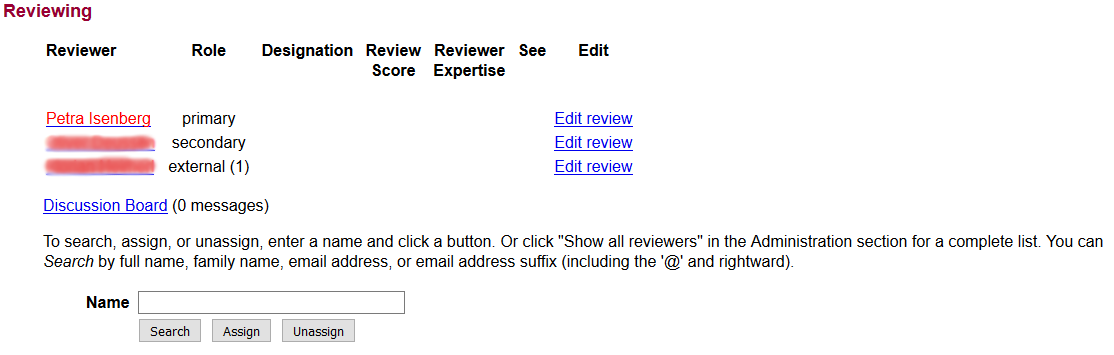
Every paper in the dataset (of type "J" and "C") has undergone a process called peer-review (read the following wikipedia article for more details). This means that in order to get accepted at the IEEE VIS conference, the paper has been assigned to four reviewers all of which read the paper, gave comments, and gave it an accept or reject recommendation. The process of peer-review, however, is not without problems (see this Nature article or this JRSM paper). One of the challenges with peer-review is finding the right experts for a paper with a given topic. These experts have to have two main properties:
- they need to be (very) knowledgeable about the topic of the paper. Knowledge about a topic, can, for example be established by looking at the past work of a reviewer -- their past papers and the topics of these papers. A knowledgeable reviewer is also typically one who has been active in the community by publishing papers for a few years (although it does sometimes happen that a PhD student with only 1-2 published papers can become a reviewer if they are sufficiently specialized).
- they are not allowed to be in conflict with any of the authors of the paper. A conflict arises if a reviewer has co-authored a publications (with any of the authors of the paper subjected to peer review) within the last five years (there are also other sources of conflict such as joint grants, friendships, or supervisor-student relationships - that we will not consider here).
Here a picture of what a typical reviewer assignment page looks like.
Your task
Your task is to build a system that would help someone find a good peer-reviewer for a given paper. This project can be tackled as follows:
- Build an interface that allows finding researchers with expertise in a given topic:
- allows entering or selecting a few starting keywords (or if you'd like to do something more sophisticated, the abstract of a paper)
- from those keywords find authors who have written papers with similar key terms
- build a graphical representation of authors you found and their level of expertise in the topics entered. You need to find a metric that calculates level of expertise - or find a way to visualize several metrics. For example, the number of papers published on a topic can establish expertise but also the author order - that is, the first author is usually the most knowledgeable about a topic. The last author is usually an advisor and is also pretty knowledgeable (but not as knowledgeable as the first author) and the people in the middle usually helped out - the order of expertise should give the first author the highest score, the last the second highest and the middle people a bit of a lower score (feel free to come up with something more sophisticated). An important part of the score should also how long it has been since someone published on a given topic. You'd like reviewers who have worked on a topic within the last few years rather than someone who hasn't published on a paper for a number of years.
- it would also be nice to see the relationships between the topics entered - has someone published at the intersection of key terms before or just papers about parts of the keywords?
- To improve the project:
- add to the interface the option to add the authors of the paper you are searching reviewers for
- visually highlight conflicts of interest among the suggested peer reviewers (there was a joint publication within the past three years)
- add a visualization of the co-authorship connections between the suggested reviewers
2) Visualize a Research Career
The community of visualization is extremely divers with people working on many different topics over a number of years. Given the publications of a specific researcher there are a number of interesting things we can learn about them: their history, their (changing)interests, their social network, their expertise, etc.
This is what google scholar displays for a researcher's profile. Can we provide better overviews?
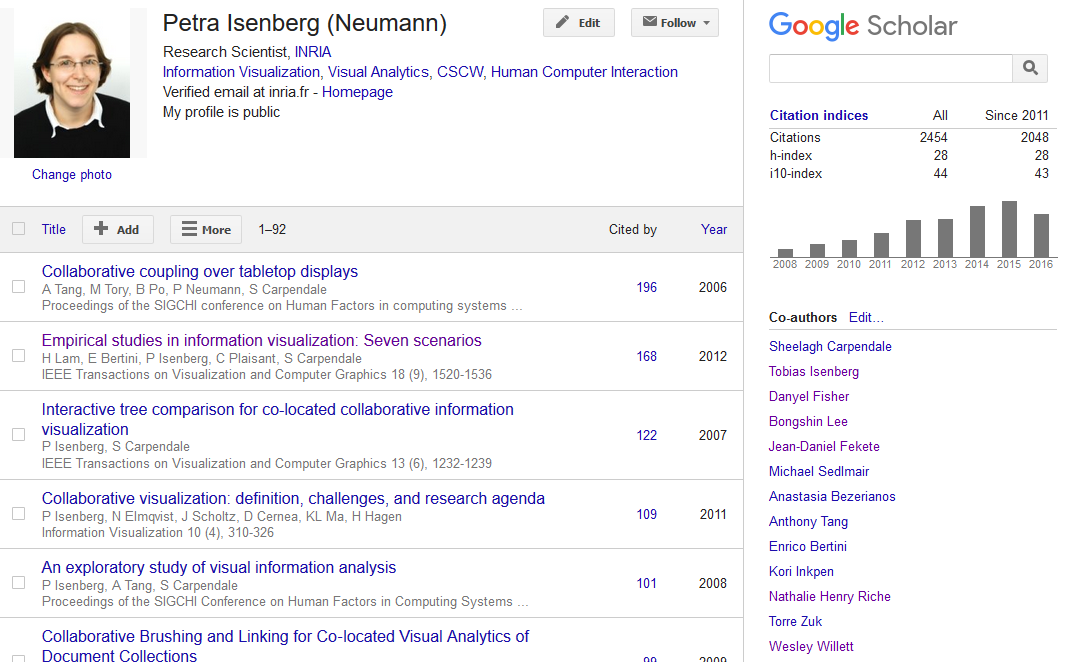
One potential research question this topic is, thus:
- What can we learn about the career of an individual visualization researcher?
Your task
- Build a tool that allows someone to choose or search for the name of an IEEE VIS author
- Design and build a visualization of several of the characteristics of their career. This visualization could show:
- a co-authorship network
- the evolving nature of topics a person has worked on
- how a person has moved around in the authorship order. Typically PhD students are first authors of scientific papers they write and their advisor is the last author. Can we see if someone has started out as a PhD student and has later become and advisor? Can we guess how many different PhD students they have had from such a visualization?
- To improve the project:
- Show similarity to other authors in the visualization dataset (which researchers is someone most similar to?)
- provide suggestions - e.g. who should someone get to know or start working with?
- suggest examples of researchers to look at (young/old ones, ones with a lot of papers, ones with a lot of diverse topics, ...)
3) Supporting Paper Writing
When writing a scientific paper, it is important to have an up-to-date background section in which the most important related articles can be found. Our dataset could be a good source for finding relevant related work.
Here an example extract of a related work section. The numbers in brackets refer to papers listed at the end of the paper in the bibliography section: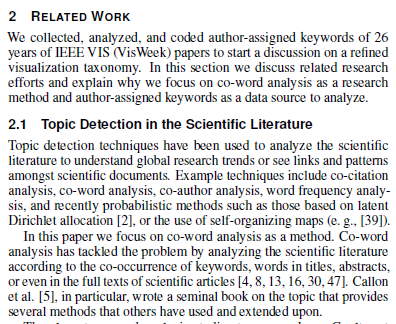
One potential research question on this topic is, thus:
- What are the most important related papers on a given topic? Can we suggest relevant literature by going beyond a simple text search on keywords, titles, and texts?
Your task
- Build a tool that allows someone to search for relevant related literature
- users should be able to enter key terms or topics, then
- find several papers with most relevance to the key terms, then
- show, for example, a citation network with at least 2 levels. Lets say the starting papers cite papers Xn - which other papers are cited from all Xn? Is there any overlap? Would the cited papers make sense for the topics entered in the first step?
- take into account more information about the papers than just the citations, which papers have been cited a lot in the past? This might be an indication that they are important papers.
- To improve the project:
- Extend your visualization by displaying more information about the papers you suggest in your visualization. E.g. a keyword landscape or the authors who published the work, etc.
4) Open Research Project
You are also welcome to define your own visualization project - but it should be using the vispubdata dataset. I can give you additional information:
- authors and their gender
- people who have served on organizing committees in the past
and there are a number of related resources that you could use:
- The DBLP library
- The Aminer dataset
if you would like to work on your own research question or tool, send the instructor and TA an email with your proposal to get official approval BEFORE you start any work on it.
Project Advice & Requirements:
While working on your visualization keep the following in mind:
- remove all papers from your data that have a paper type "M". We do not care about these papers as they have not gone through regular scientific peer review in most cases
- If you would like to use the author affiliation column, I highly recommend to spend some time learning a data wrangling tool such as Open Refine and to clean up this column first.
Project Presentation and Submission
Check out the dedicated page with instructions on how to prepare for the project demo and submission