Visualization and Visual Analytics for Data Science 2018-2019
Part of the Data Science Master Course
Crédits : 5 ECTS
Goals
- Understanding how visualization works, perceptually and cognitively, to make sense and explore complex data
- Knowing the most efficient visualization techniques according to data structures and tasks
- Learning how to apply visualization to machine learning and complex data analysis for transparency, inspection, and debugging
- Familiarize with popular tools for crafting and using visualizations.
Description of the Course
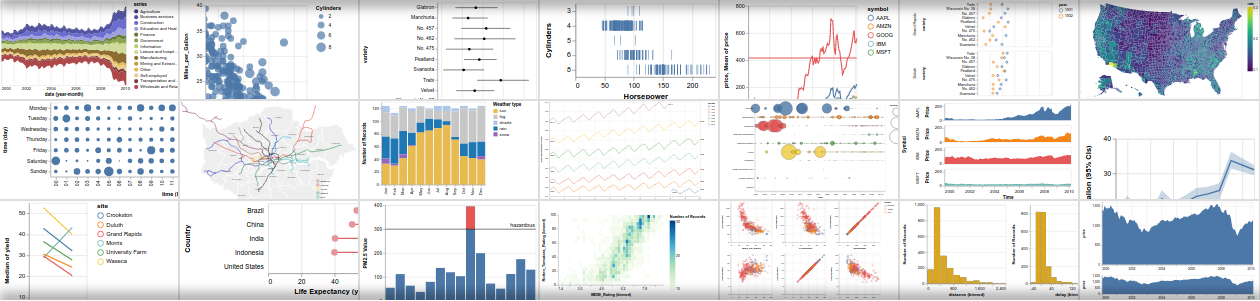
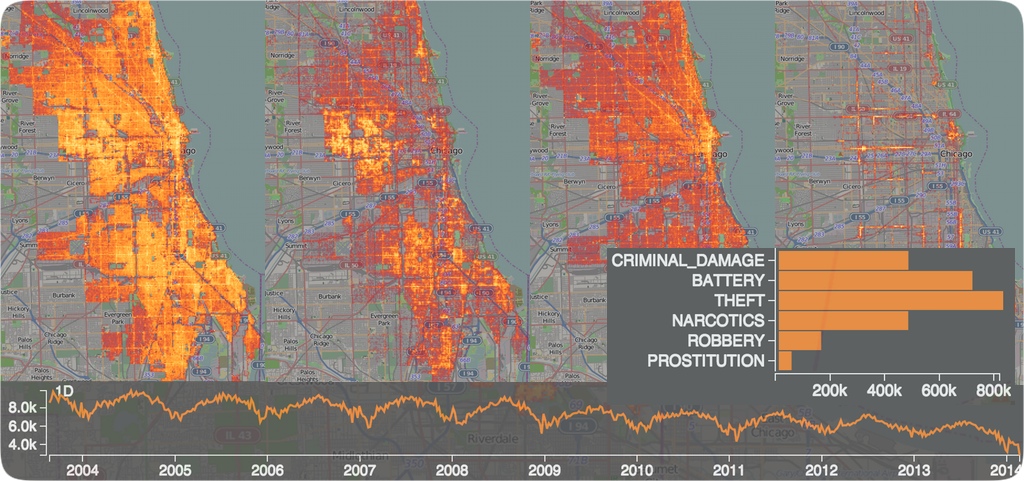
Visualization plays an important role in Data Science for allowing humans to make sense of data and its analyses. This course will introduce you to techniques and tools for analyzing and visualizing data. It emphasizes how to combine computation and visualization to perform effective analysis. The course consists of two parts: a series of lectures on analytics and a series of lectures on visualization. Both parts will include hands-on tutorials during which you will work on analysis problems and start to build your own tools.
The first part will present the principles underlying visualization, related to perception, cognition, but also to design for the construction of effective visual representations and interaction techniques to allow practitioners to make sense of complex data, extract insights, and sometimes discover unexpected information from the data.
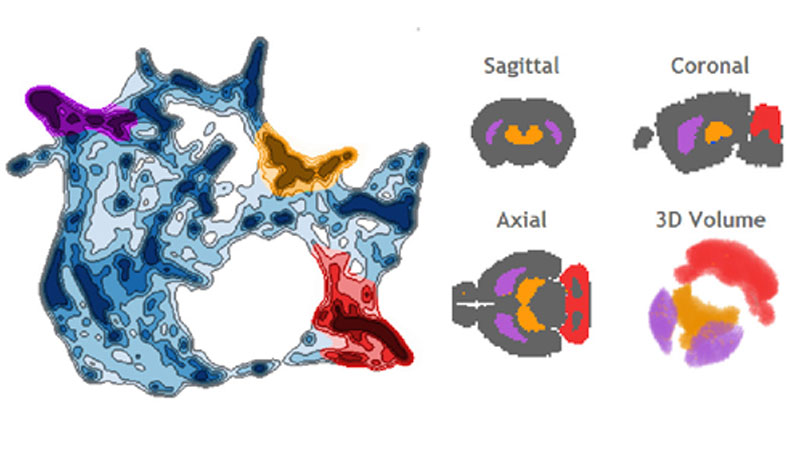
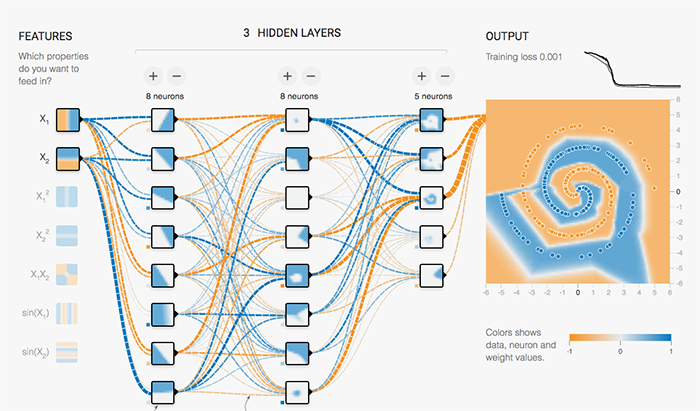
The second part will show how visualization can be used in combination with large databases and machine learning to help understanding higher-level phenomena, such as debugging complex machine-learning models, understanding the behavior of deep-learning systems, and exploring data at scale. The course will highlight principles and theories, and showcase many examples, as well as practical techniques and tools.
Course Instructors
- Jean-Daniel Fekete (Inria, main contact)
- Juliana Freire (NYU, guest teacher, databases and data science)
- Petra Isenberg (Inria, guest teacher, visualization)
- Claudio Silva (NYU, guest teacher, visualization and data science)
Location and Time
See the Schedule page above for details but generally the class runs from 2:00pm-6:00pm on Mondays at Telecom ParisTech.
Requirements
- Install Tableau data visualization software is provided through the Tableau for Teaching program. You can also get your own key by signing up for a student license or look in the Slack channel for the key for our class.
- Install R and R Studio
- Install Anaconda Python 3.6
Grading
- 40% exam
- 40% project
- 20% presentation
Late Policy
For assignments I will deduct 10% for each day (including weekends) the assignment is late.
Additional Resources
If you are interested in learning more R or Python, check out https://www.datacamp.com/