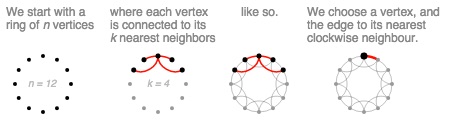
Graph Comics
 Paper
Slides
Paper
Slides
 Video
Video
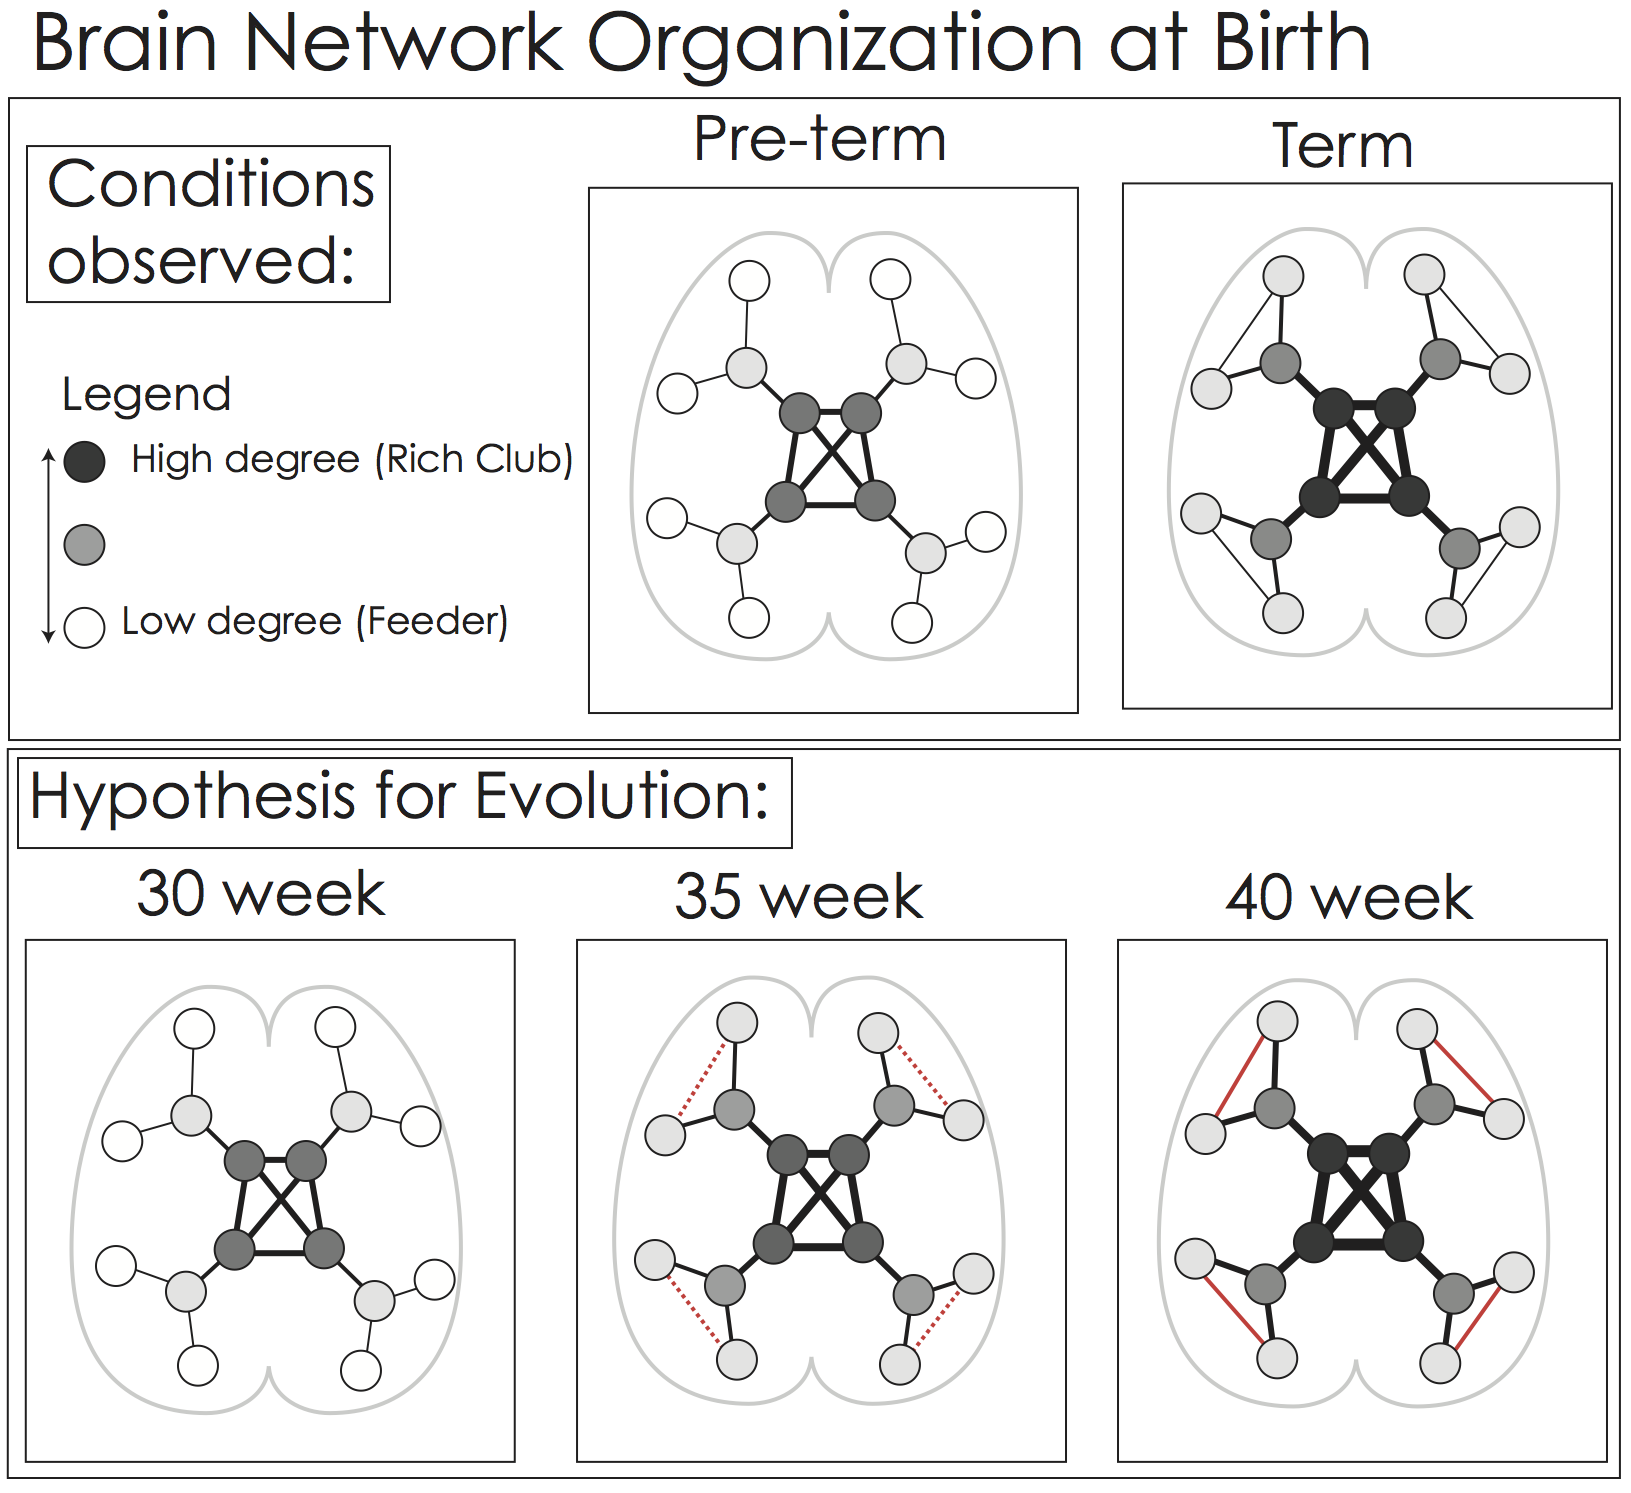
 Examples
 Design Considerations
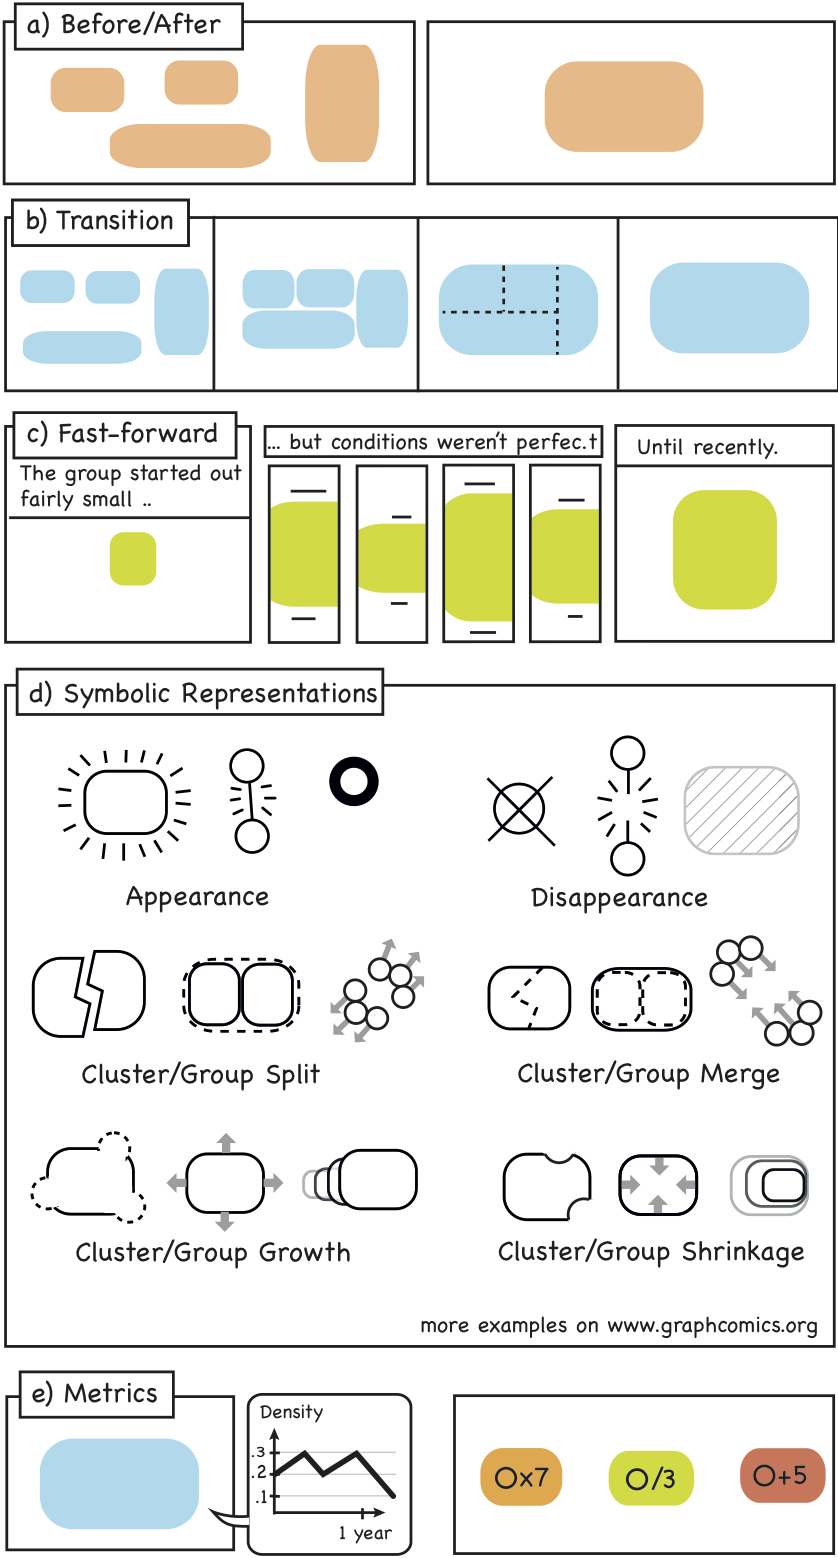
 Symbolic Representations of Change
Design Space Exploration
Symbolic Representations of Change
Design Space Exploration
 Reading Study
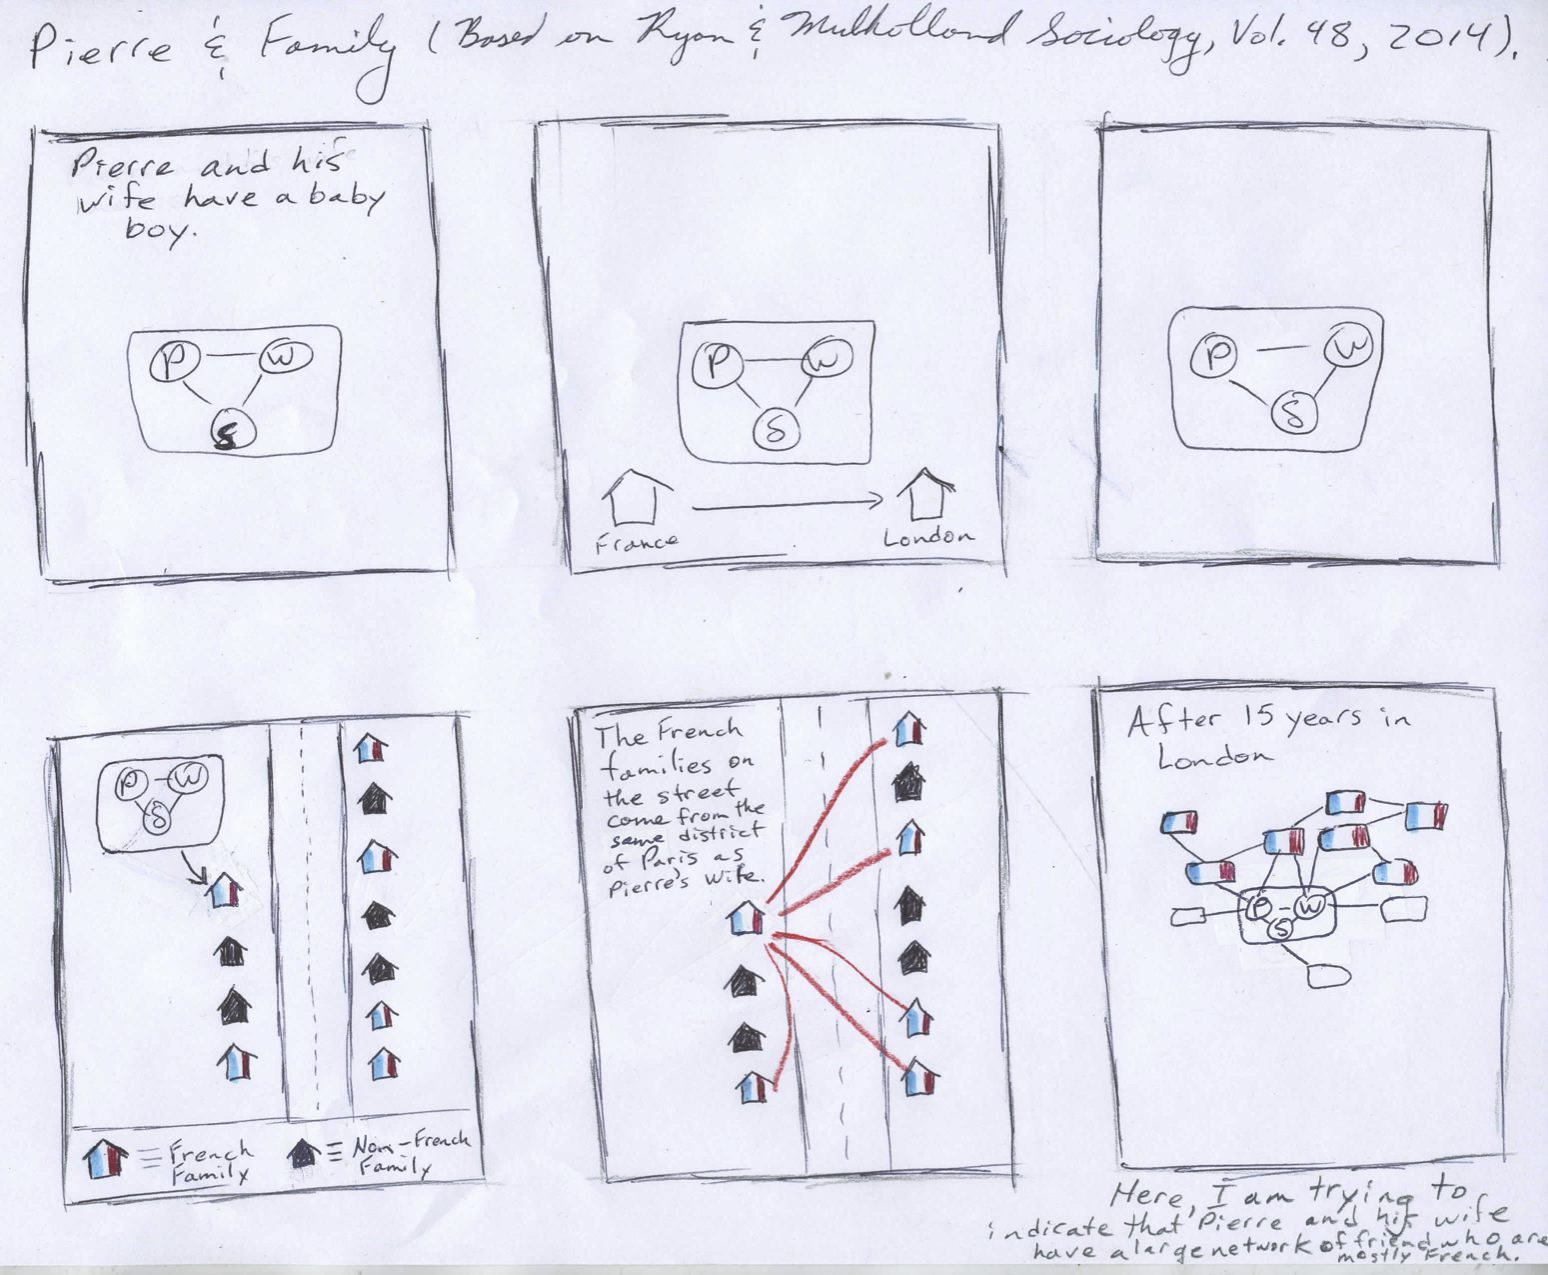
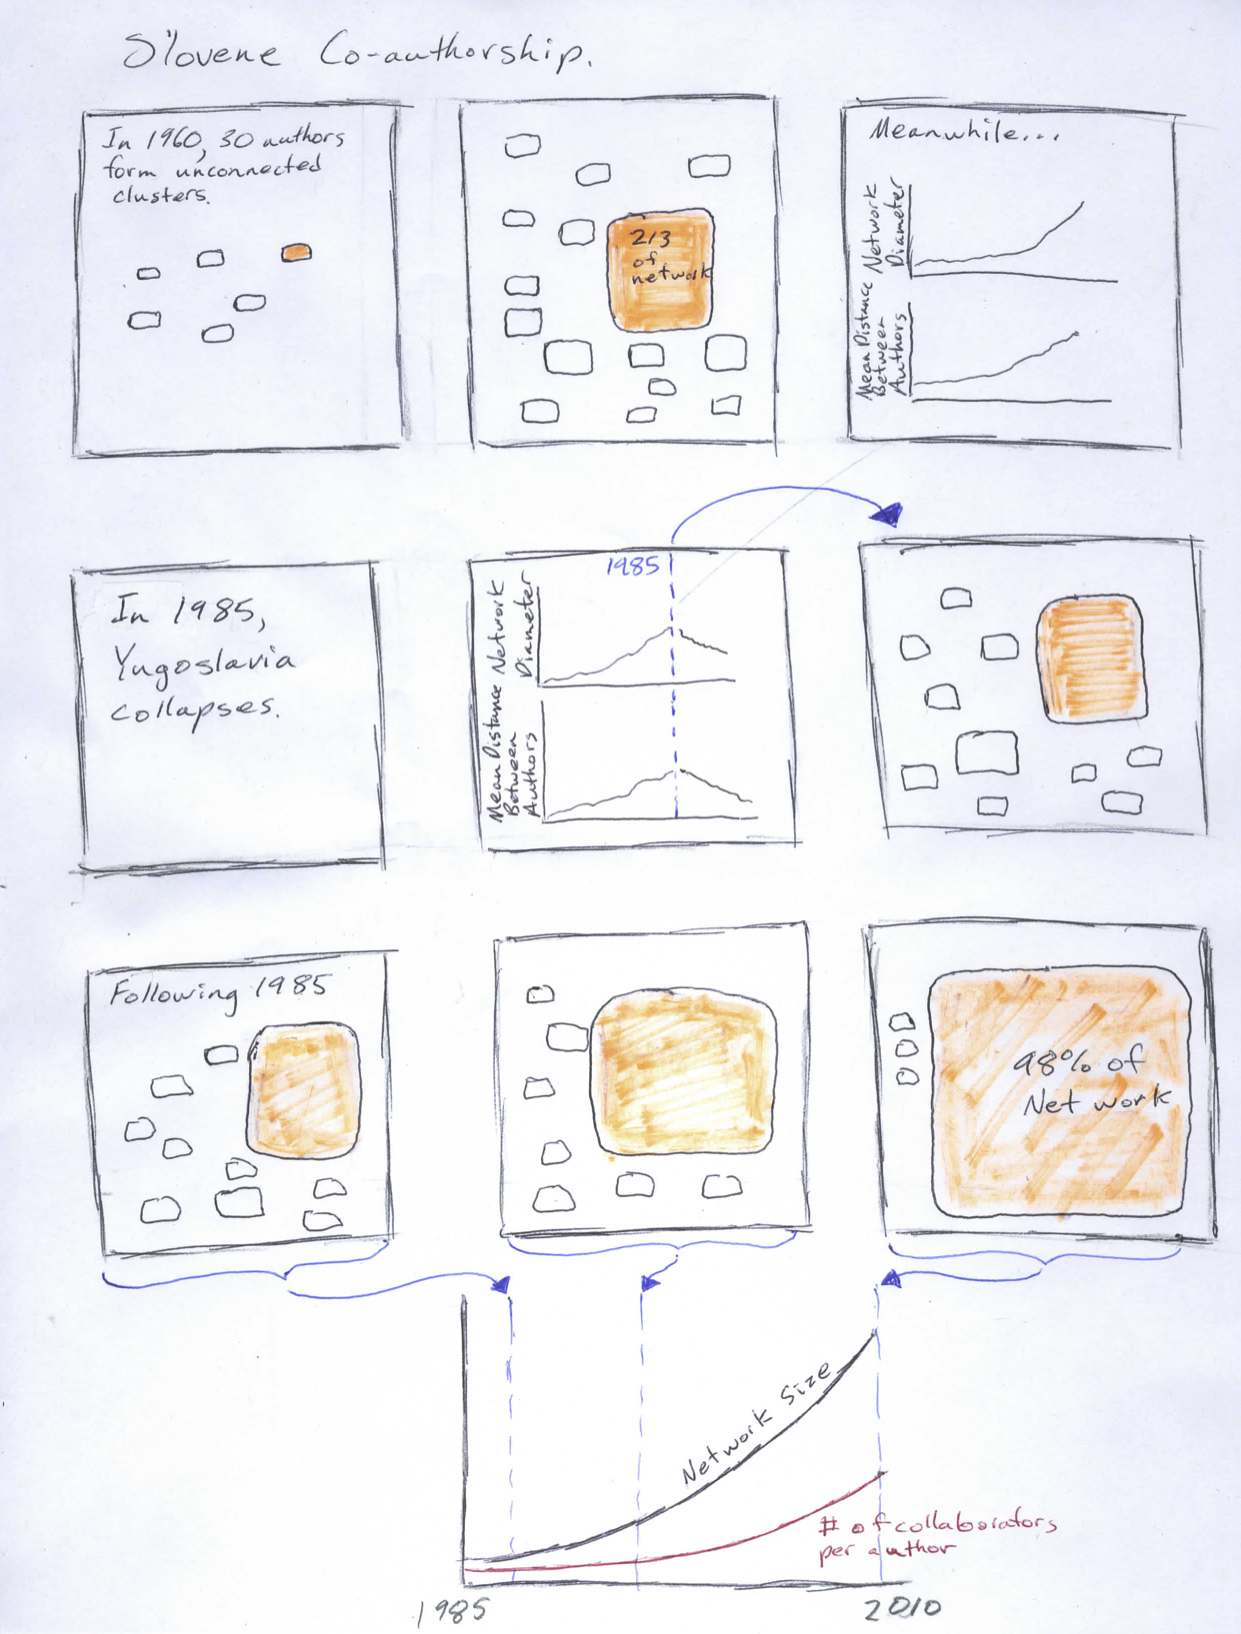
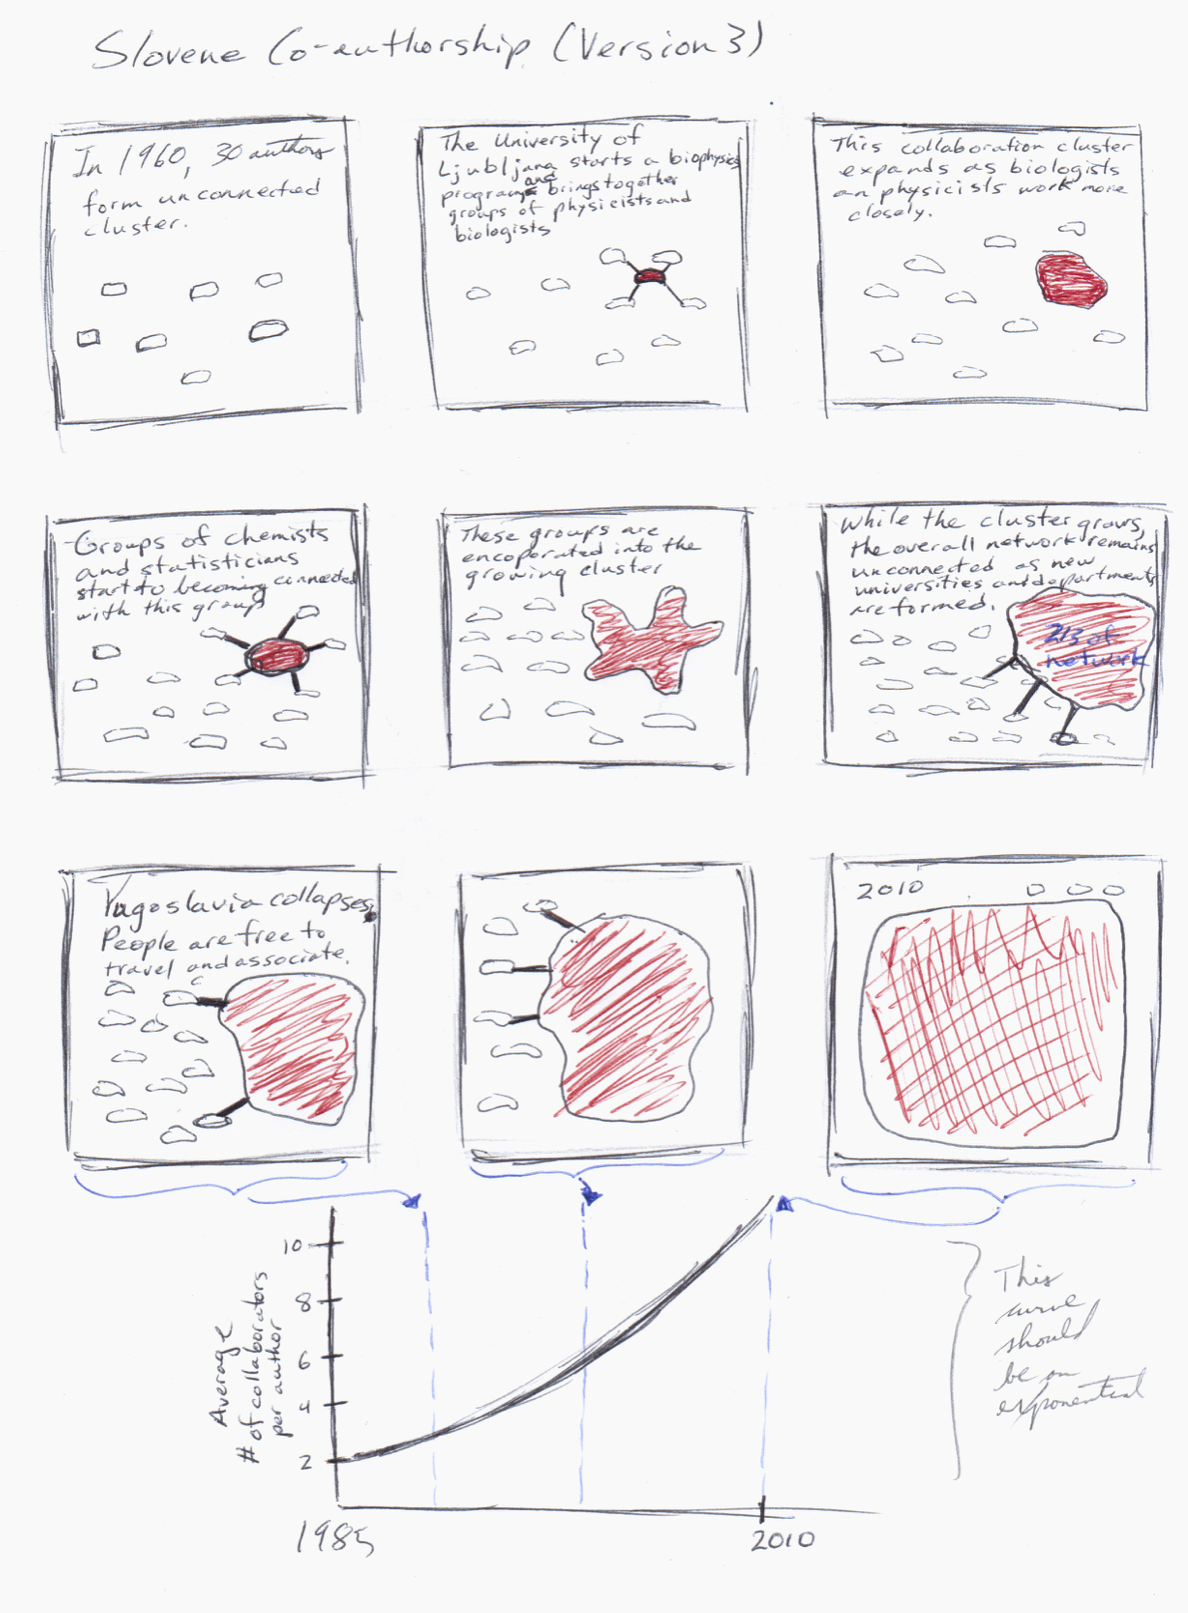
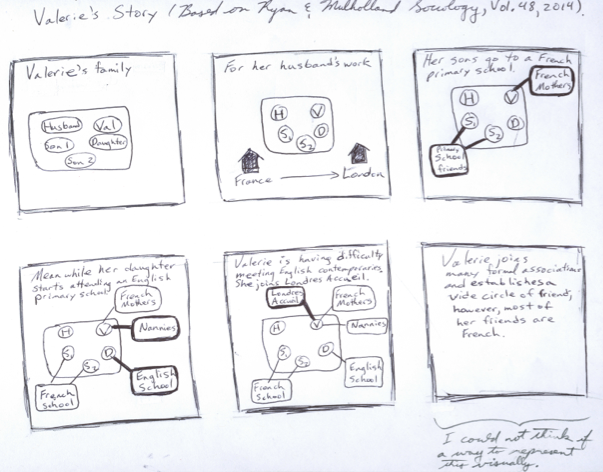
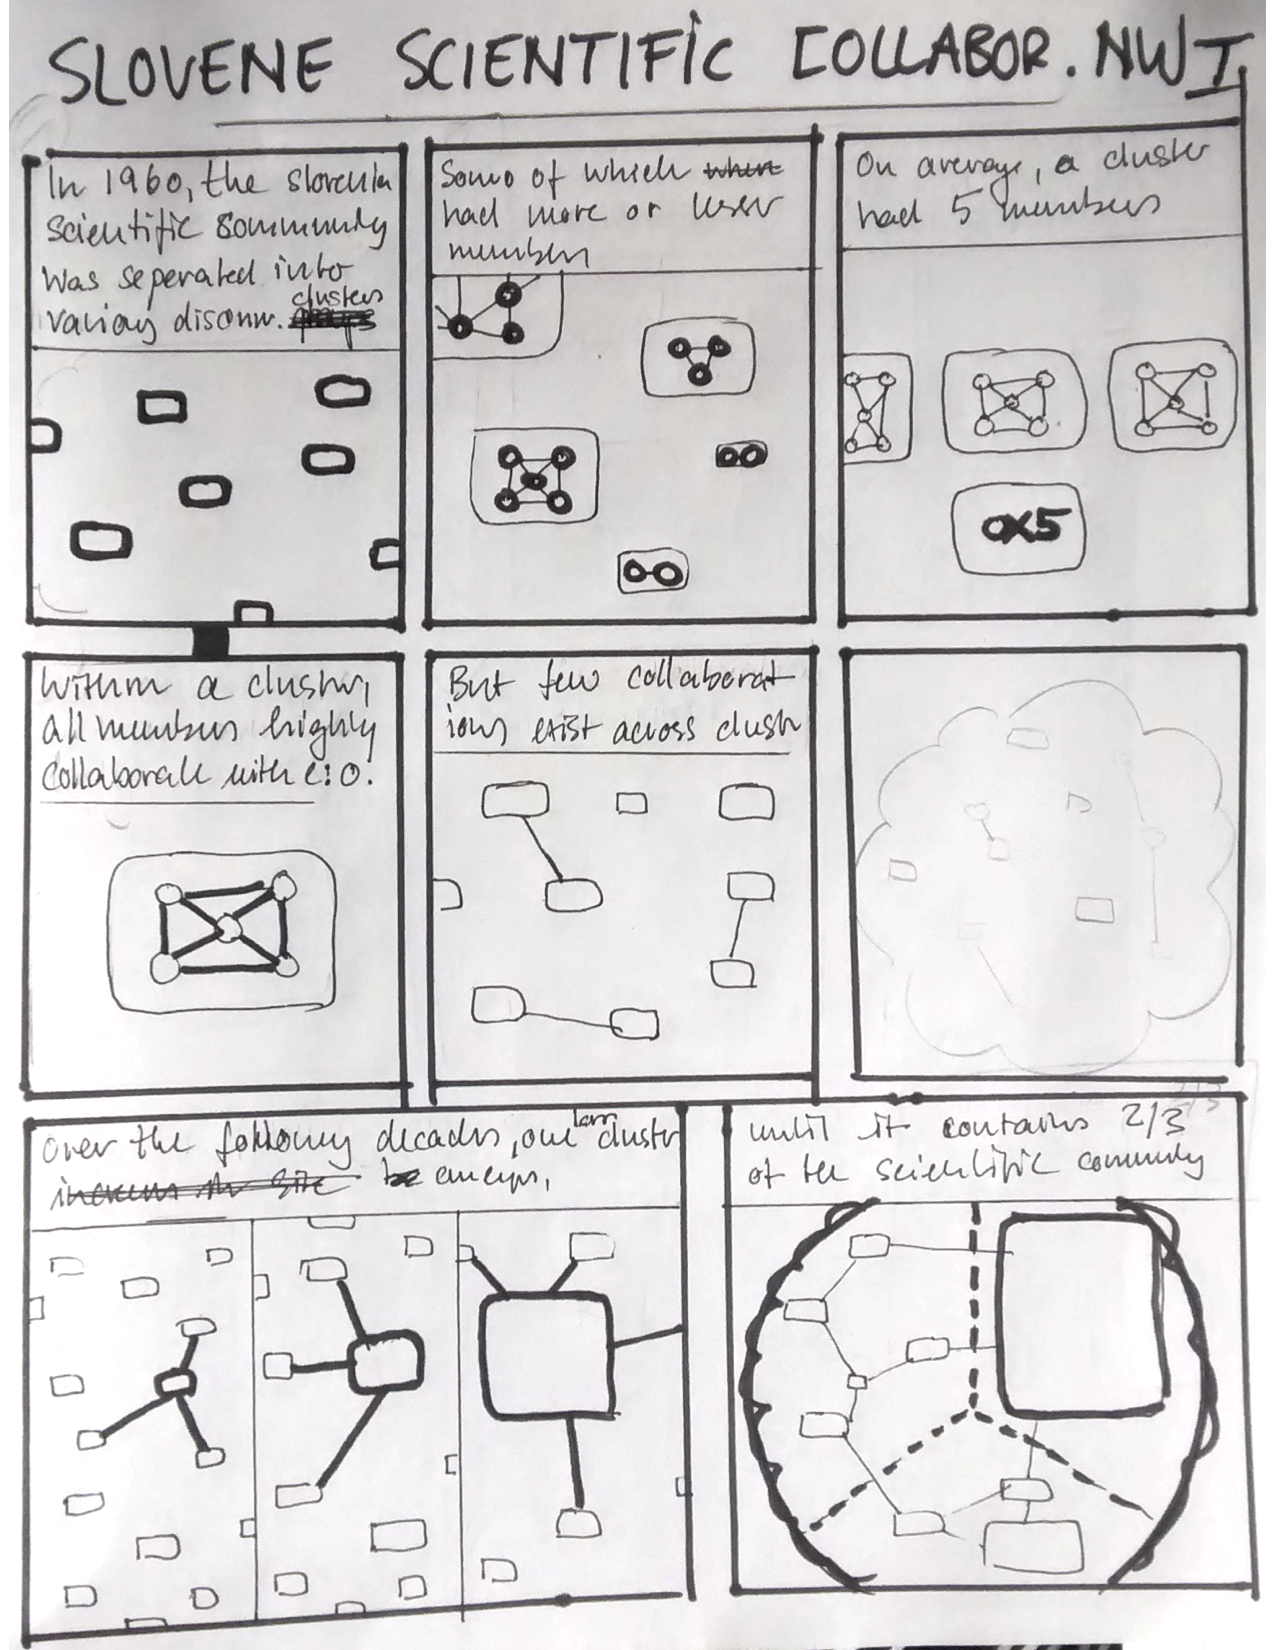
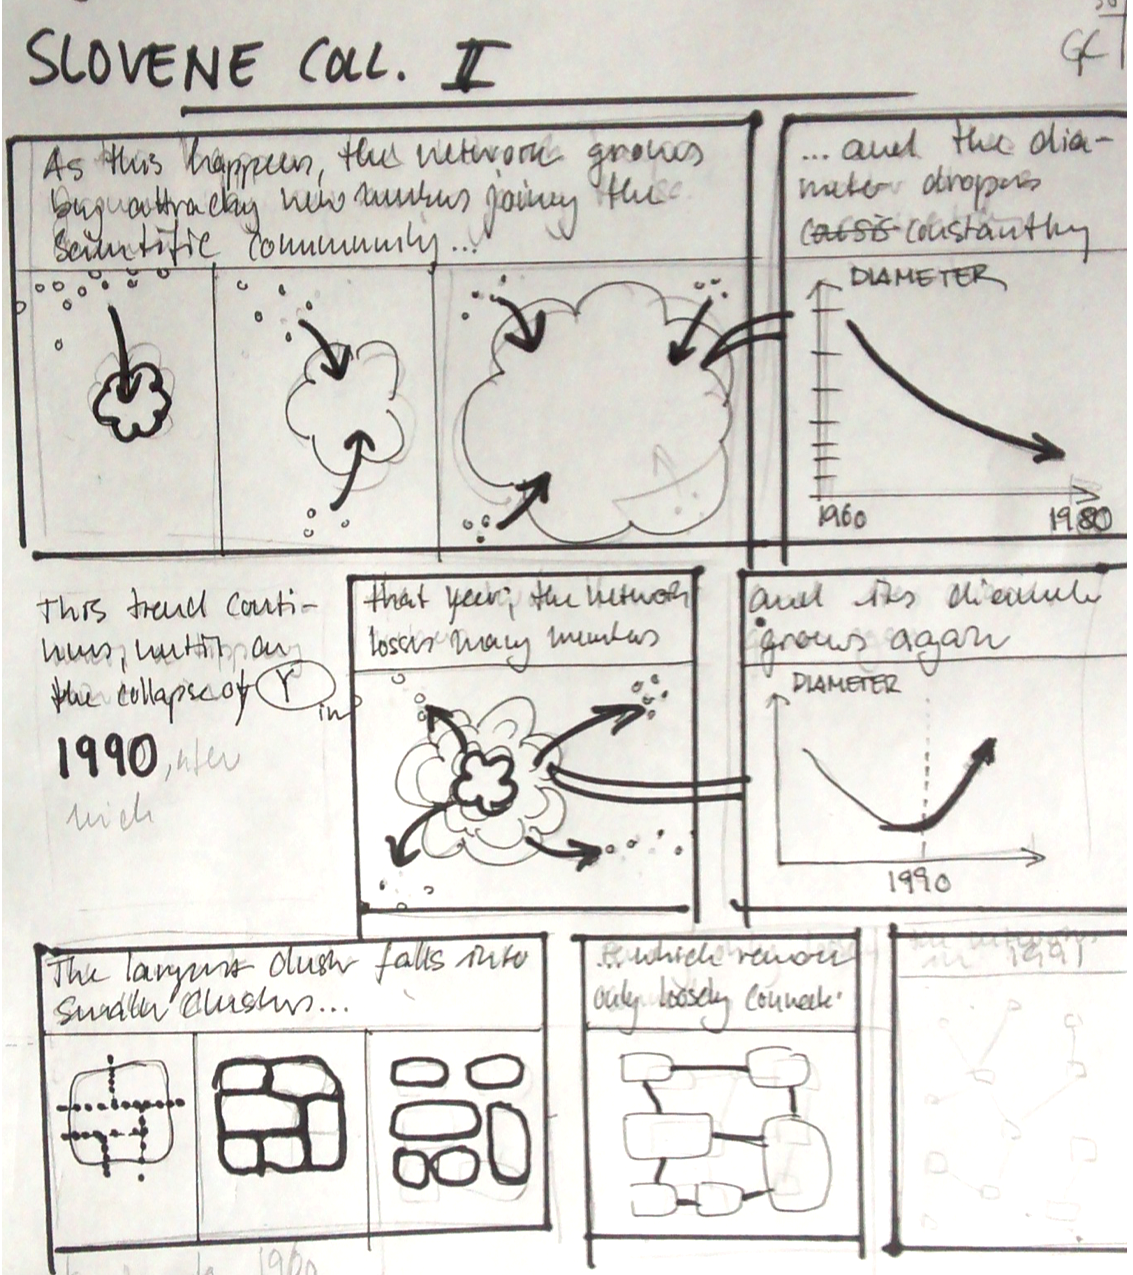
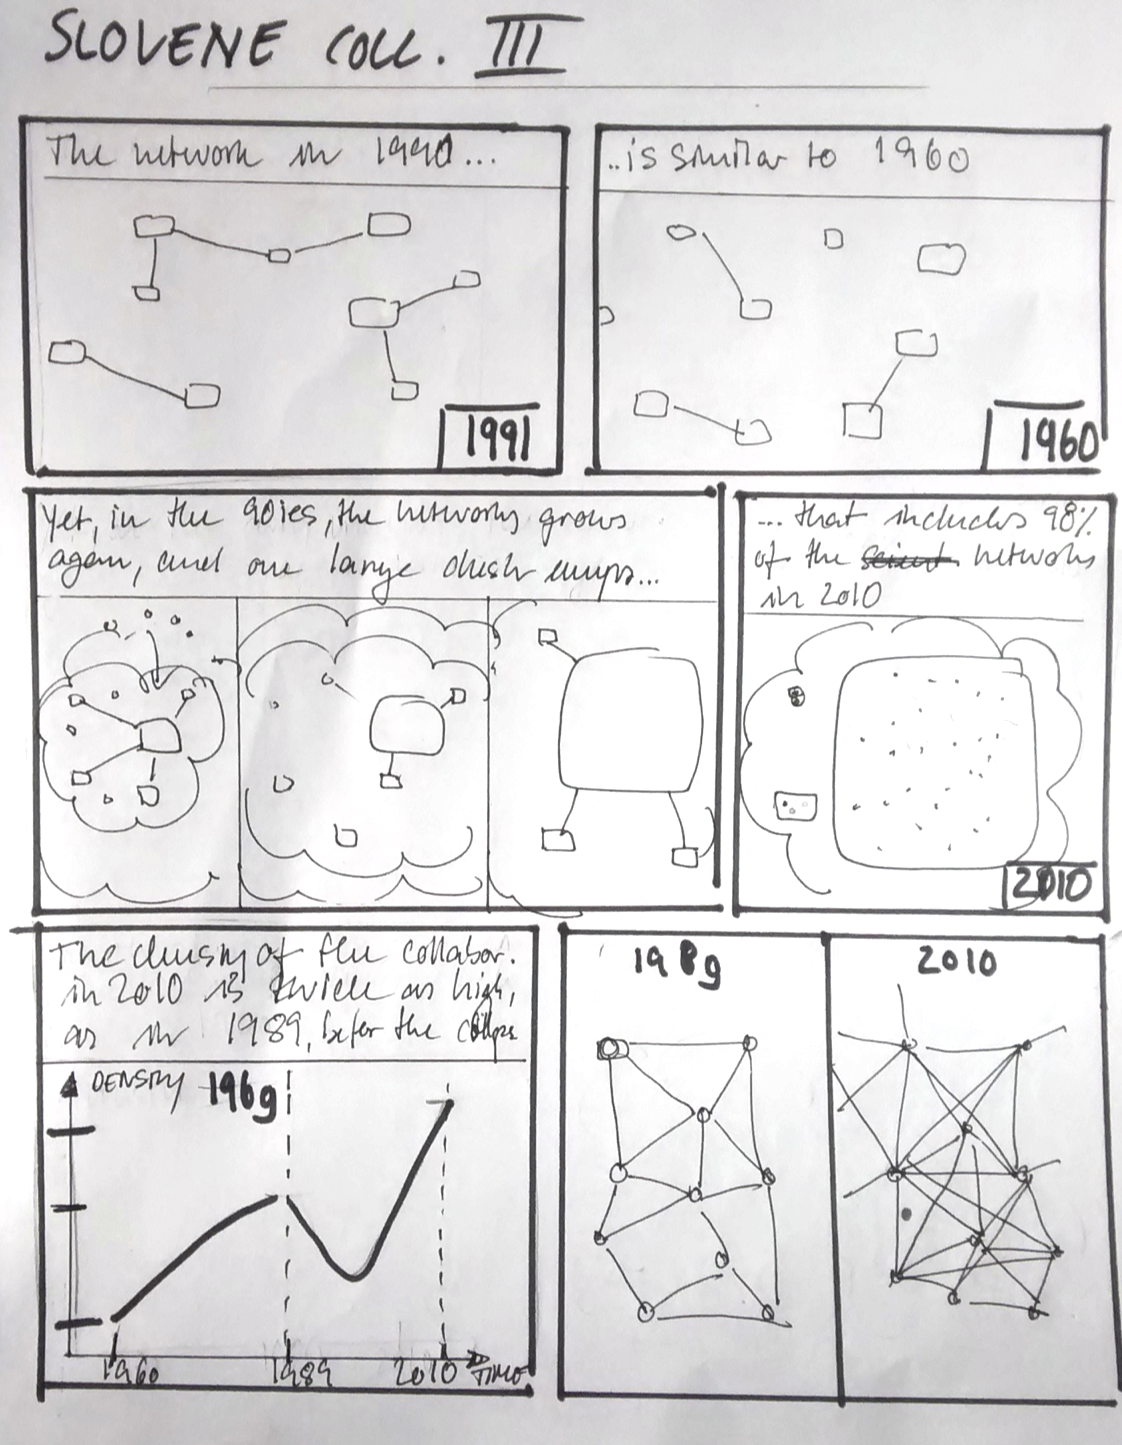
What are graph comics?
Graph comics are a visual way to communicate changes and findings found in dynamic networks. Graph comics are inspired by traditional comics.
This site provides graph comic examples
and eight design considerations to structure the process of creating such comics. Our design considerations are the following (more details are in the paper):
Video
Examples
Design Guidelines
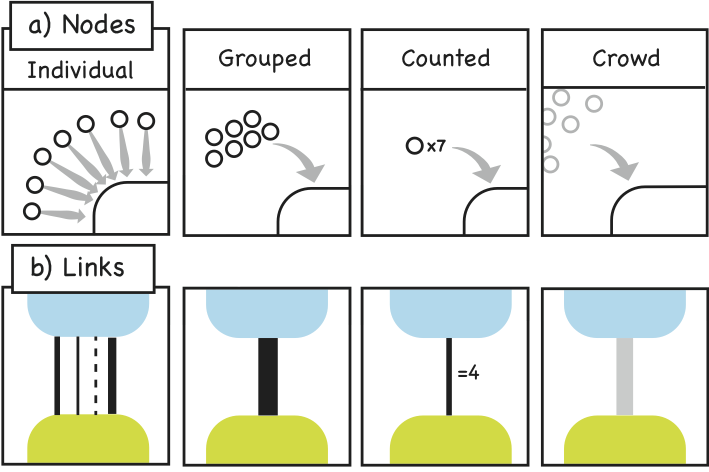
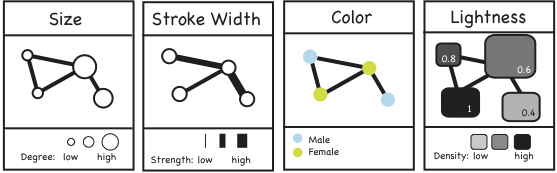
1. Visual Representation Of Graph Elements
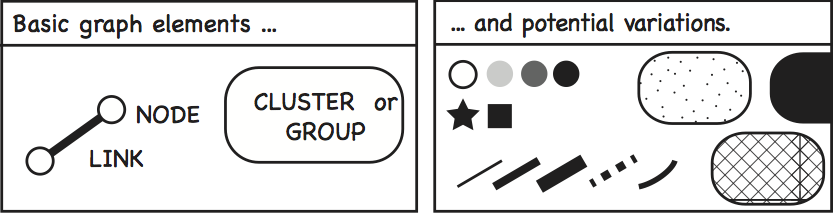
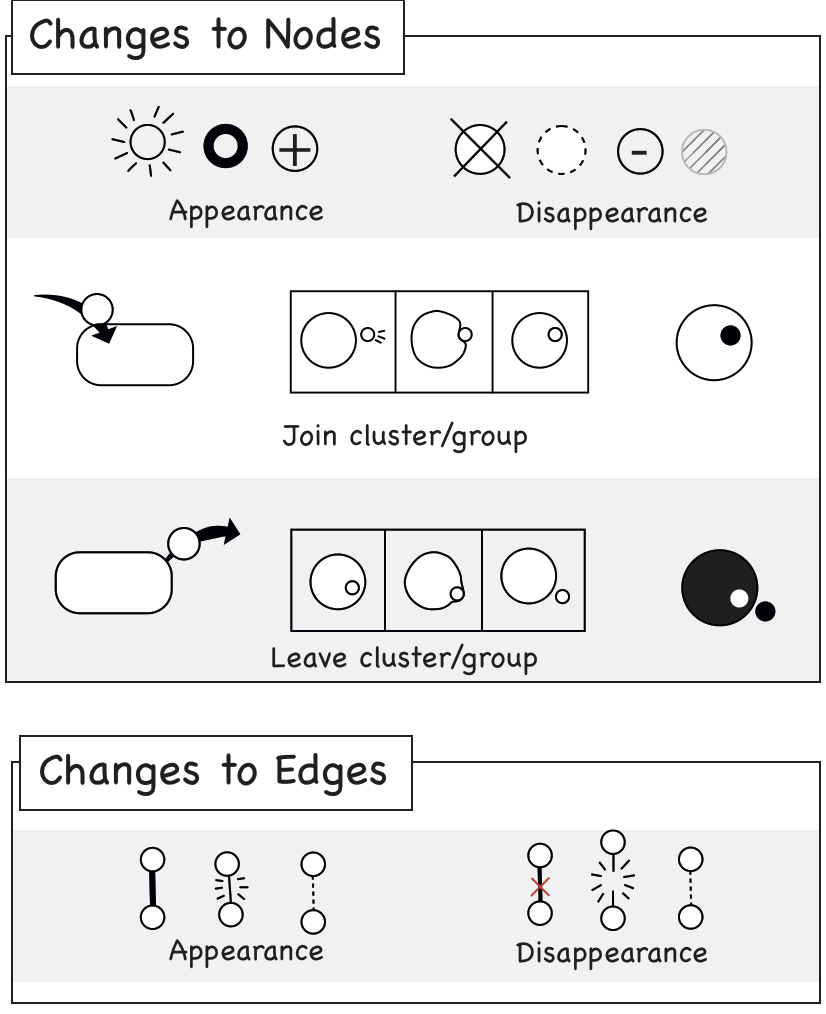
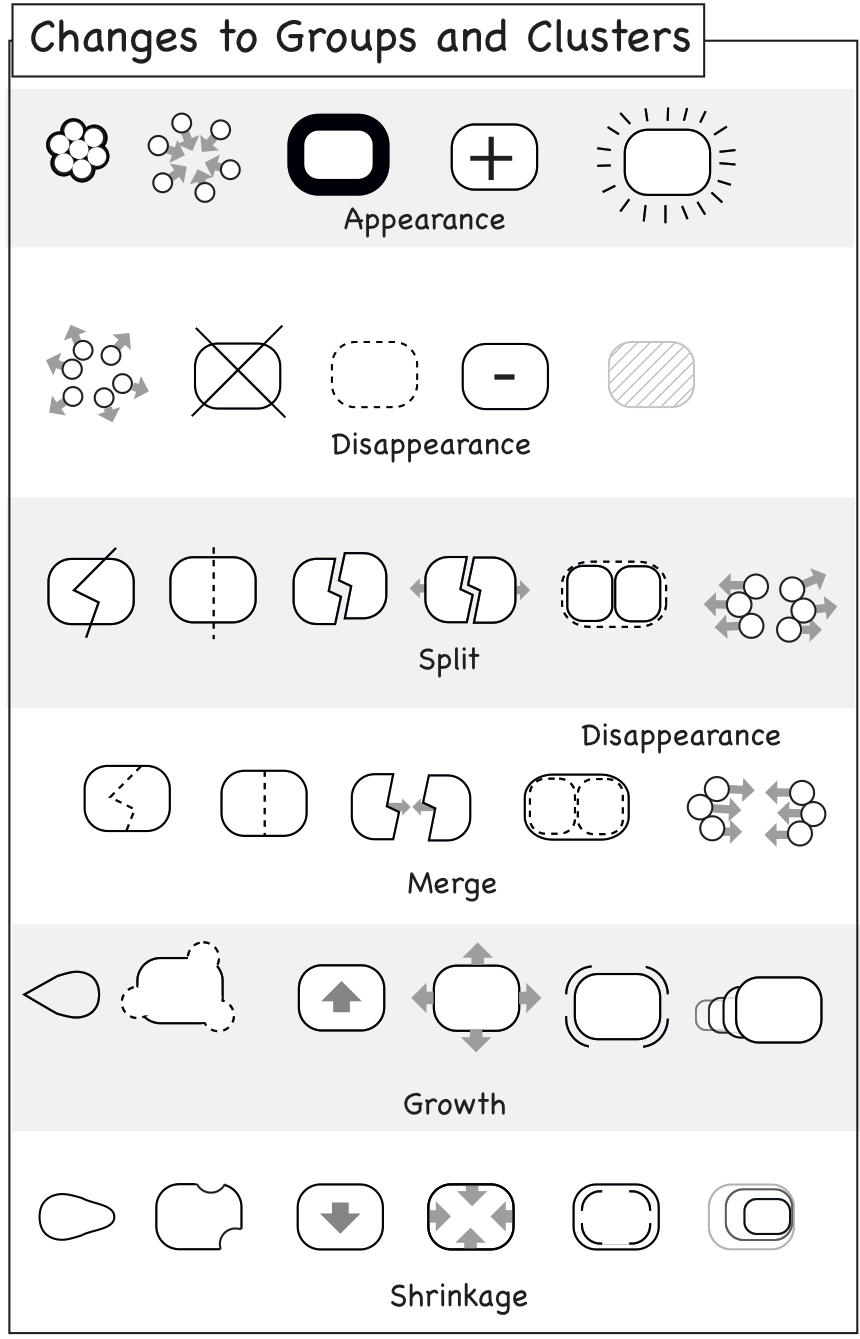
2. Visual Representation Of Change
3. Temporality of Change

4. Element Identity
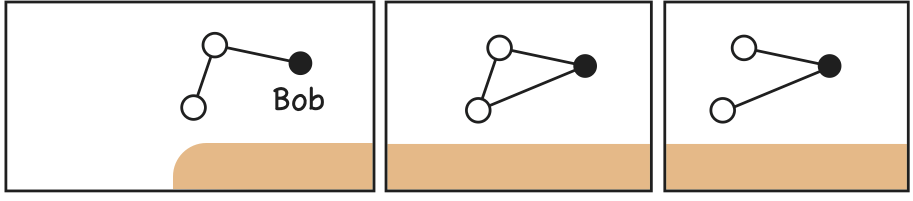
5. Cast of Character
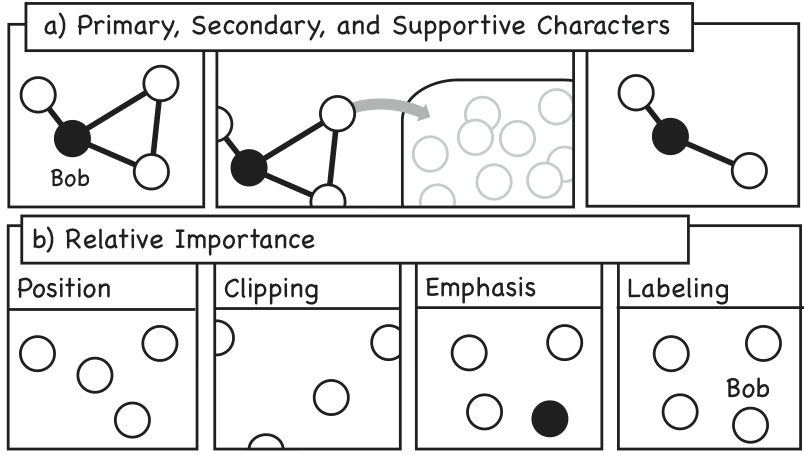
6. Level of Detail
7. Overview and Detail
8. Representation of Multivariate Networks
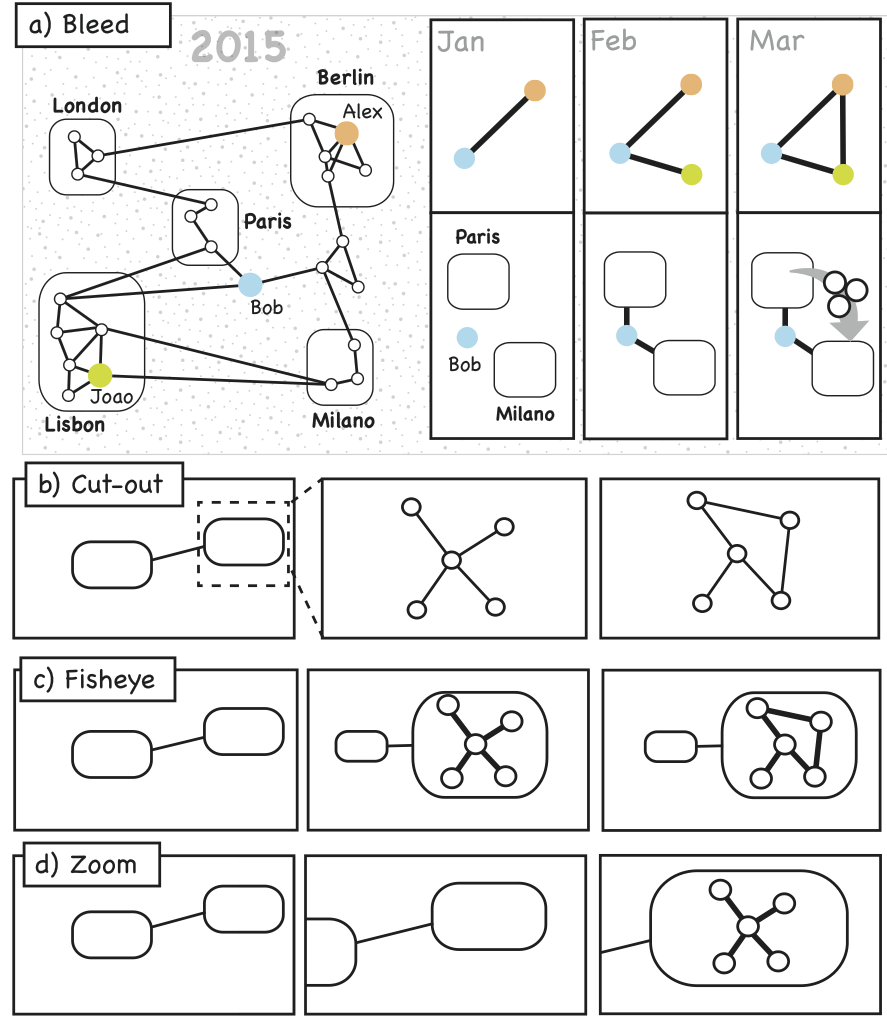
Symbolic Representations of Change
Design Process
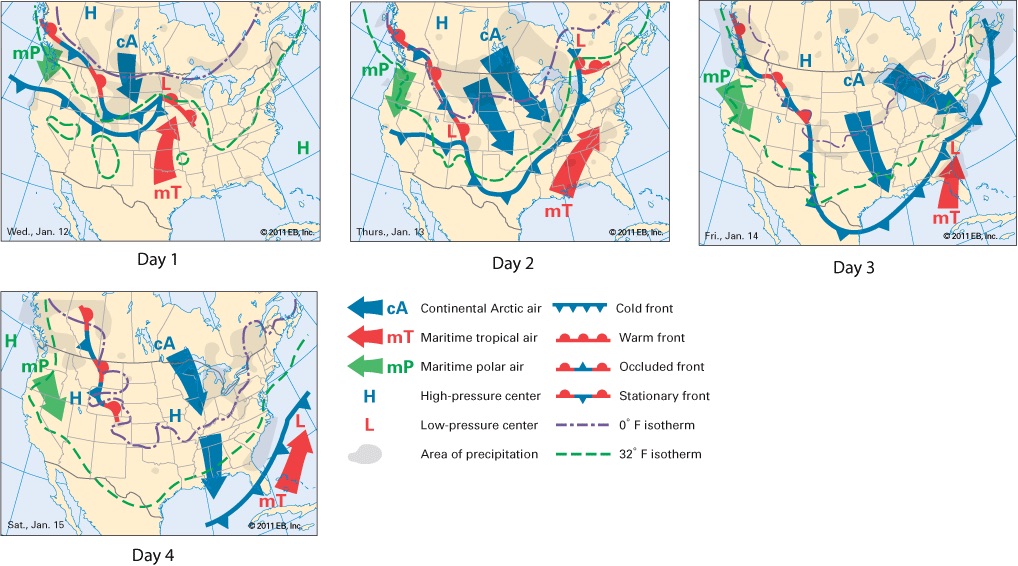
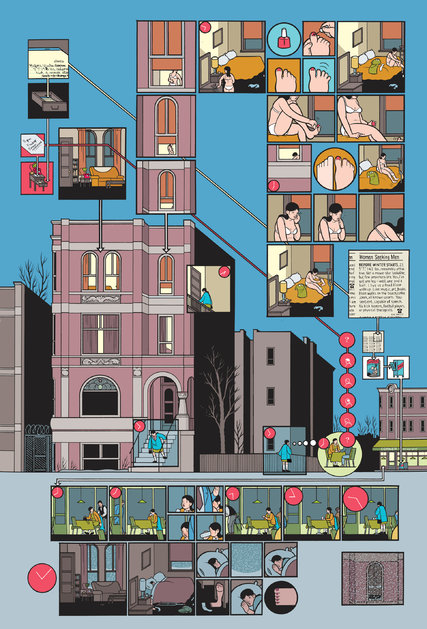
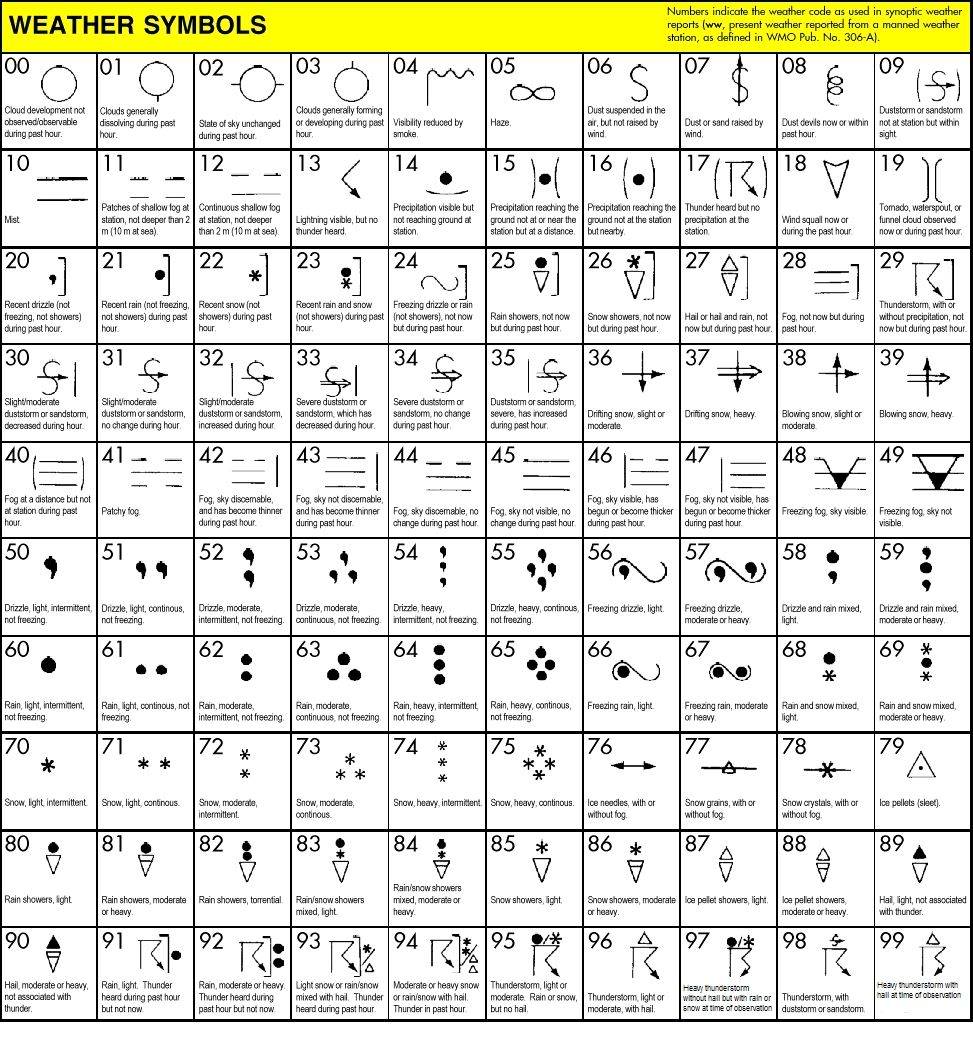
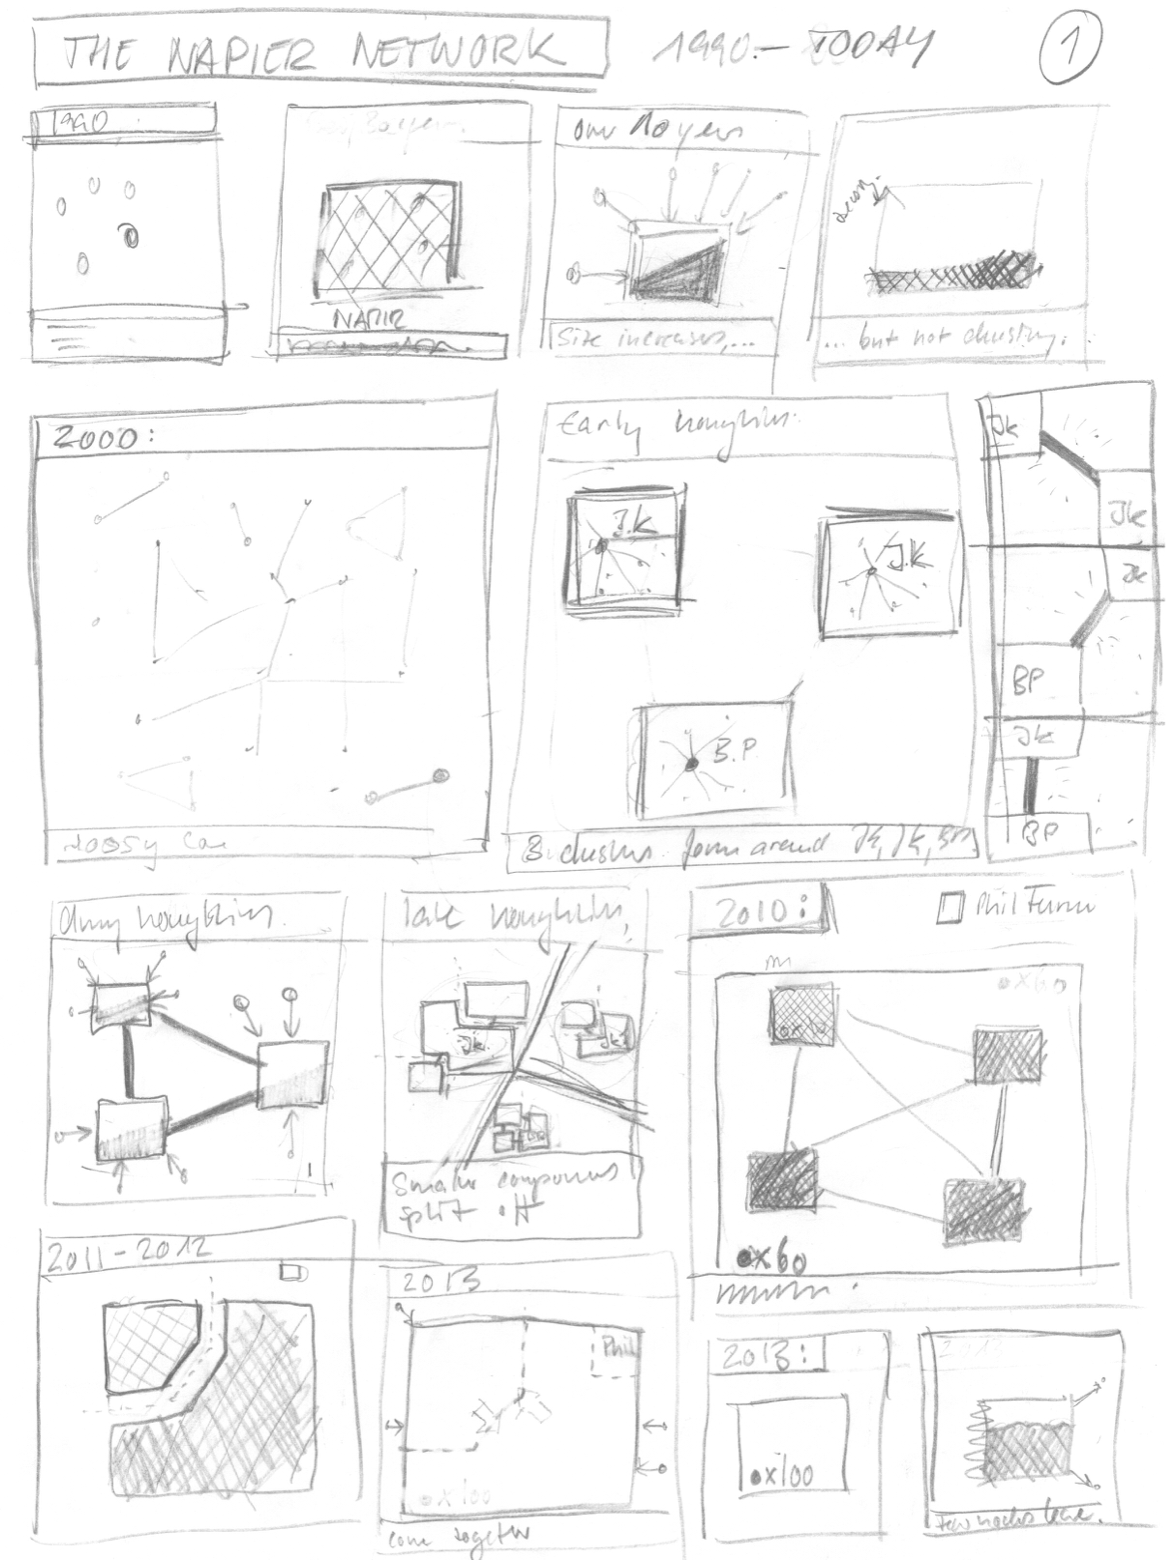
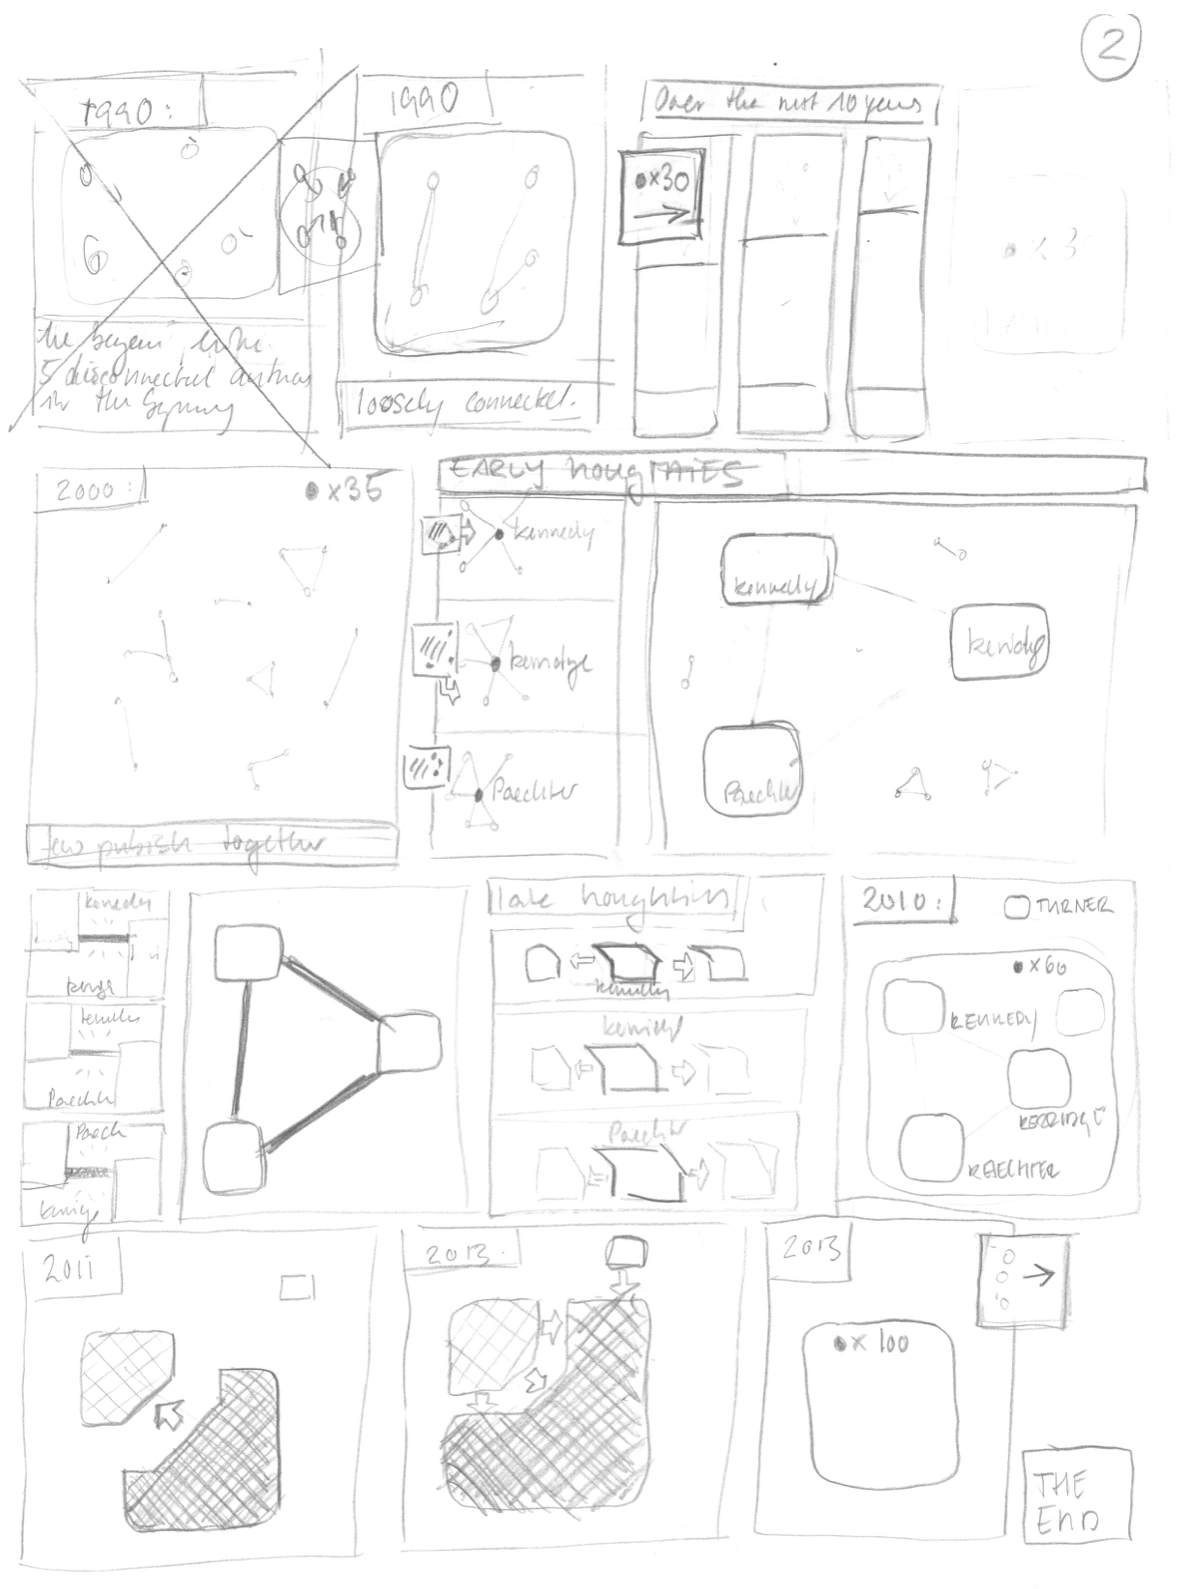
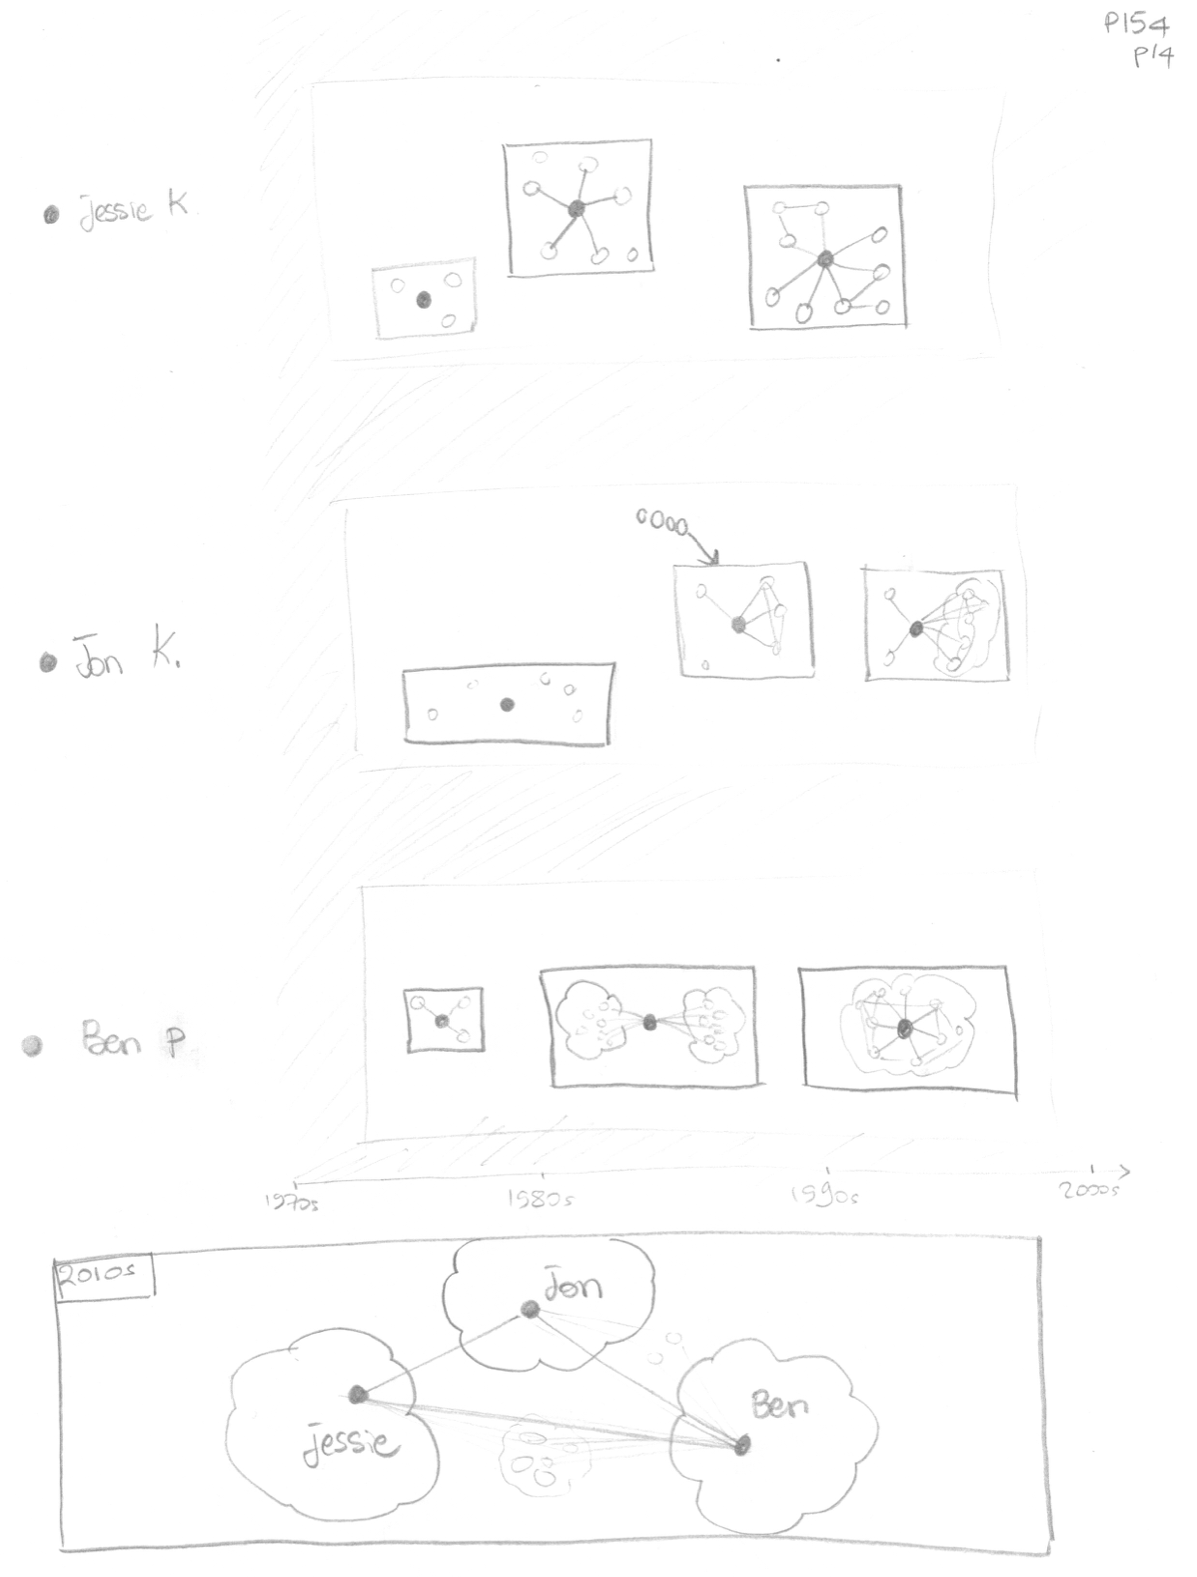
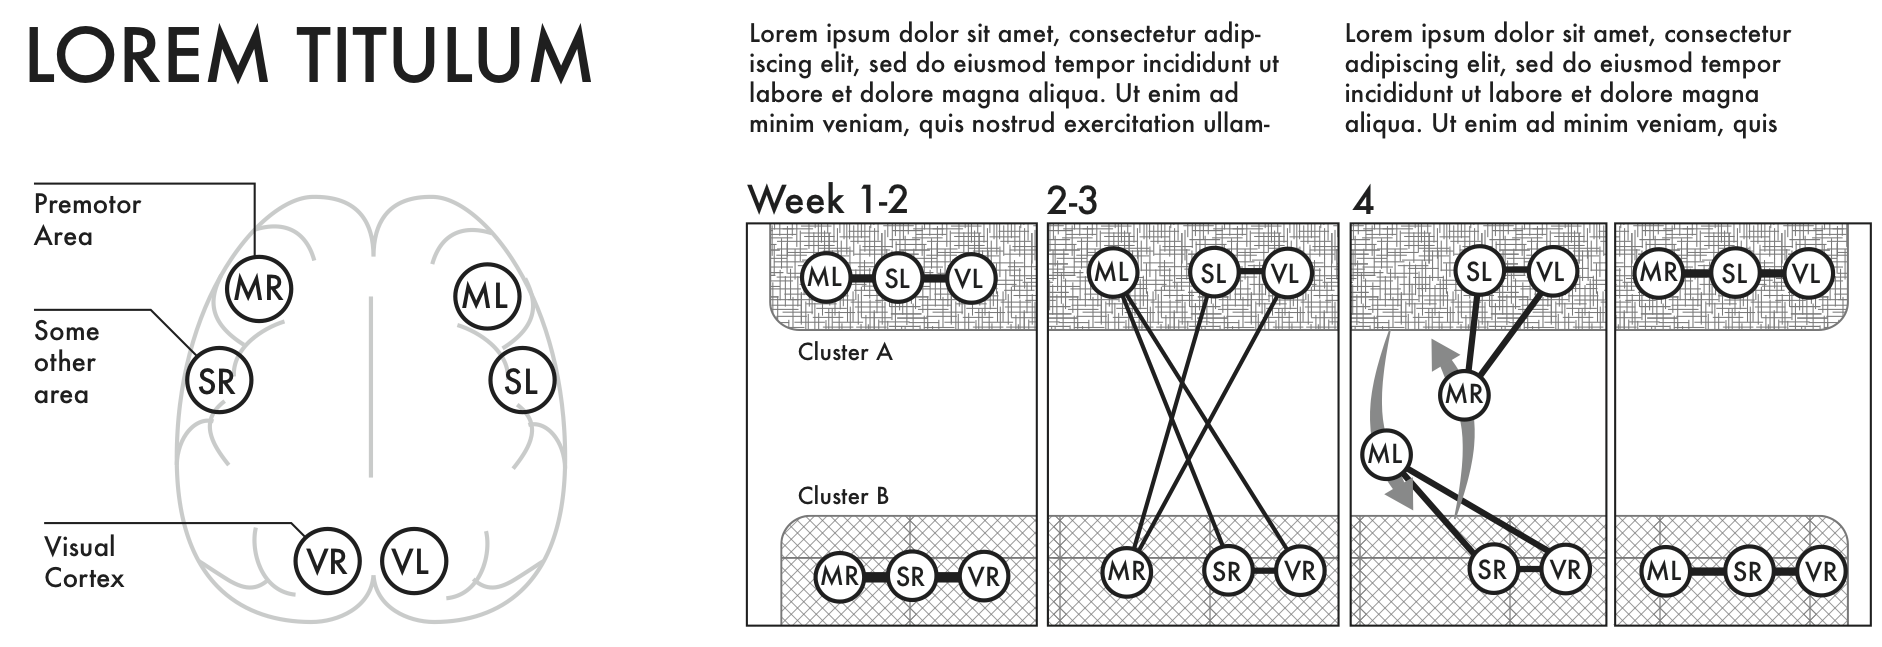
1. Graphical Review: We started by collecting a range of comics to get an overview over the graphical expressiveness and solutions employed in comics to convey aspects such as duration, order of events, and structure of scenes. We also collected examples from other graphical languages related to time: music notations, weather maps, textbook illustrations from biology and neuroscience, as well as assembly instructions.
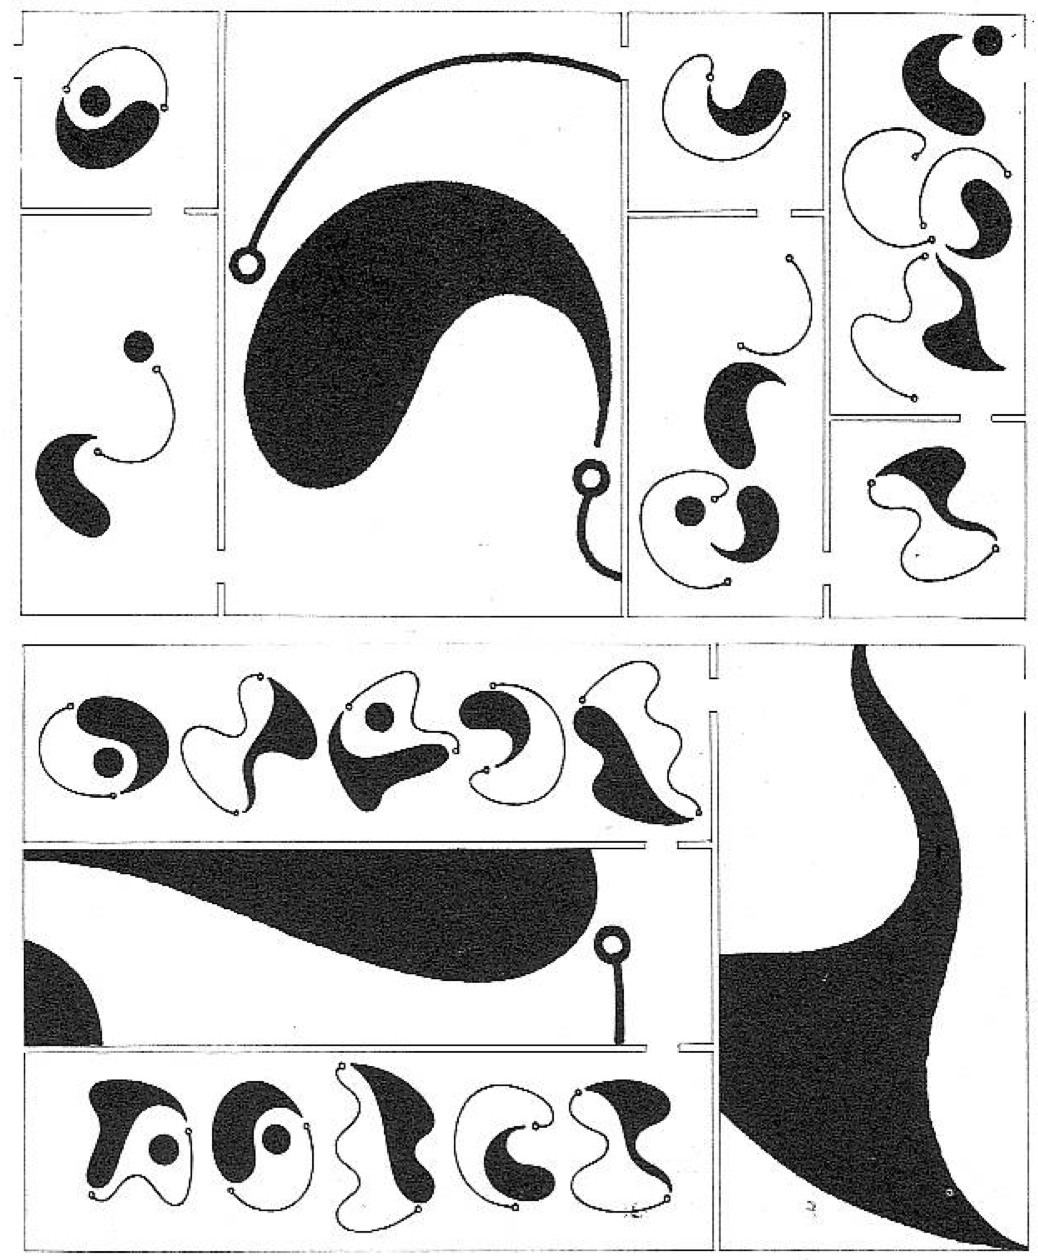
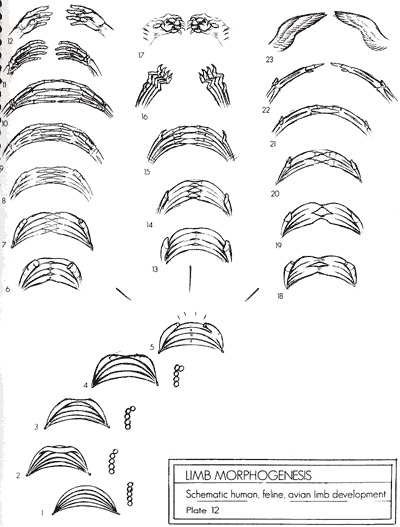
2. Graph Changes: Based on these examples, each of the authors independently created designs to illustrate changes in dynamic networks. For example, node appearance, birth of cluster, split of clusters, etc.
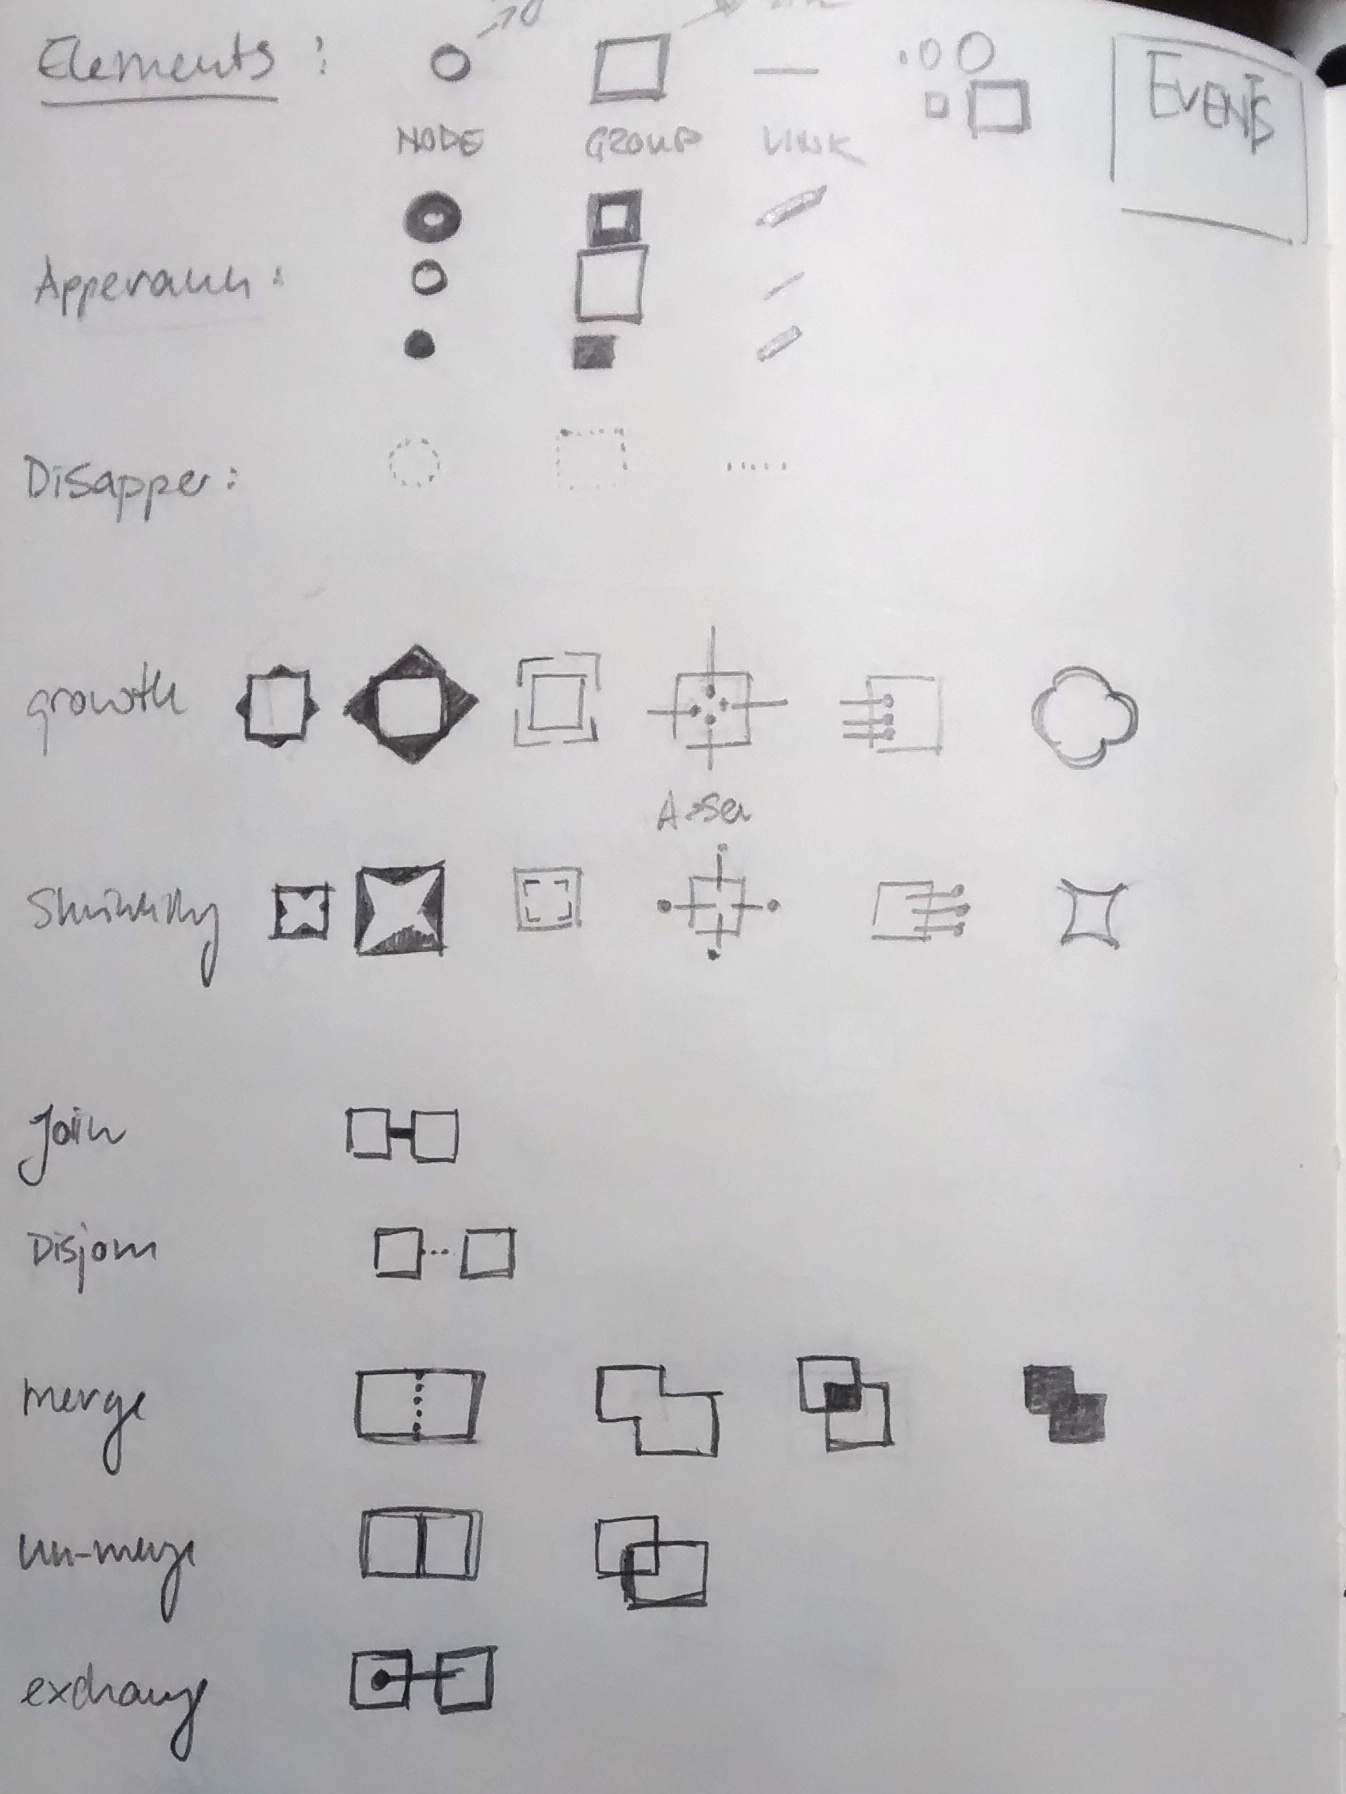
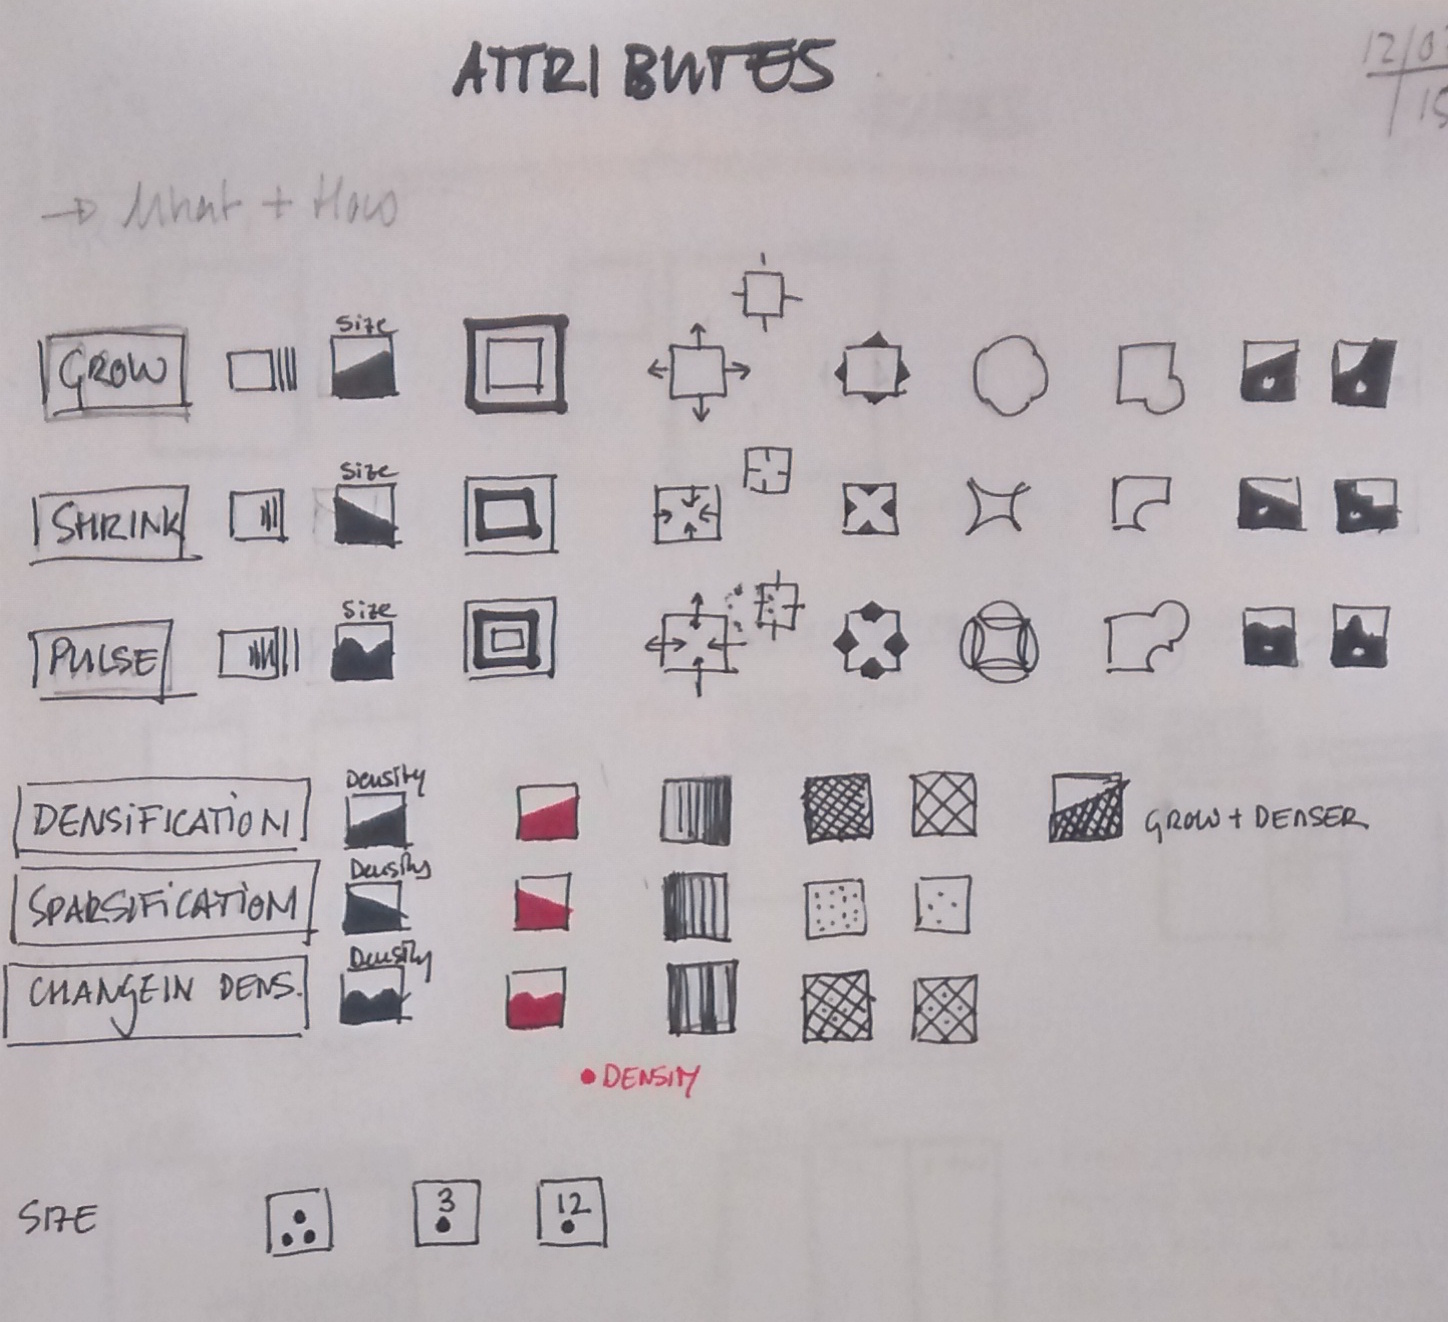


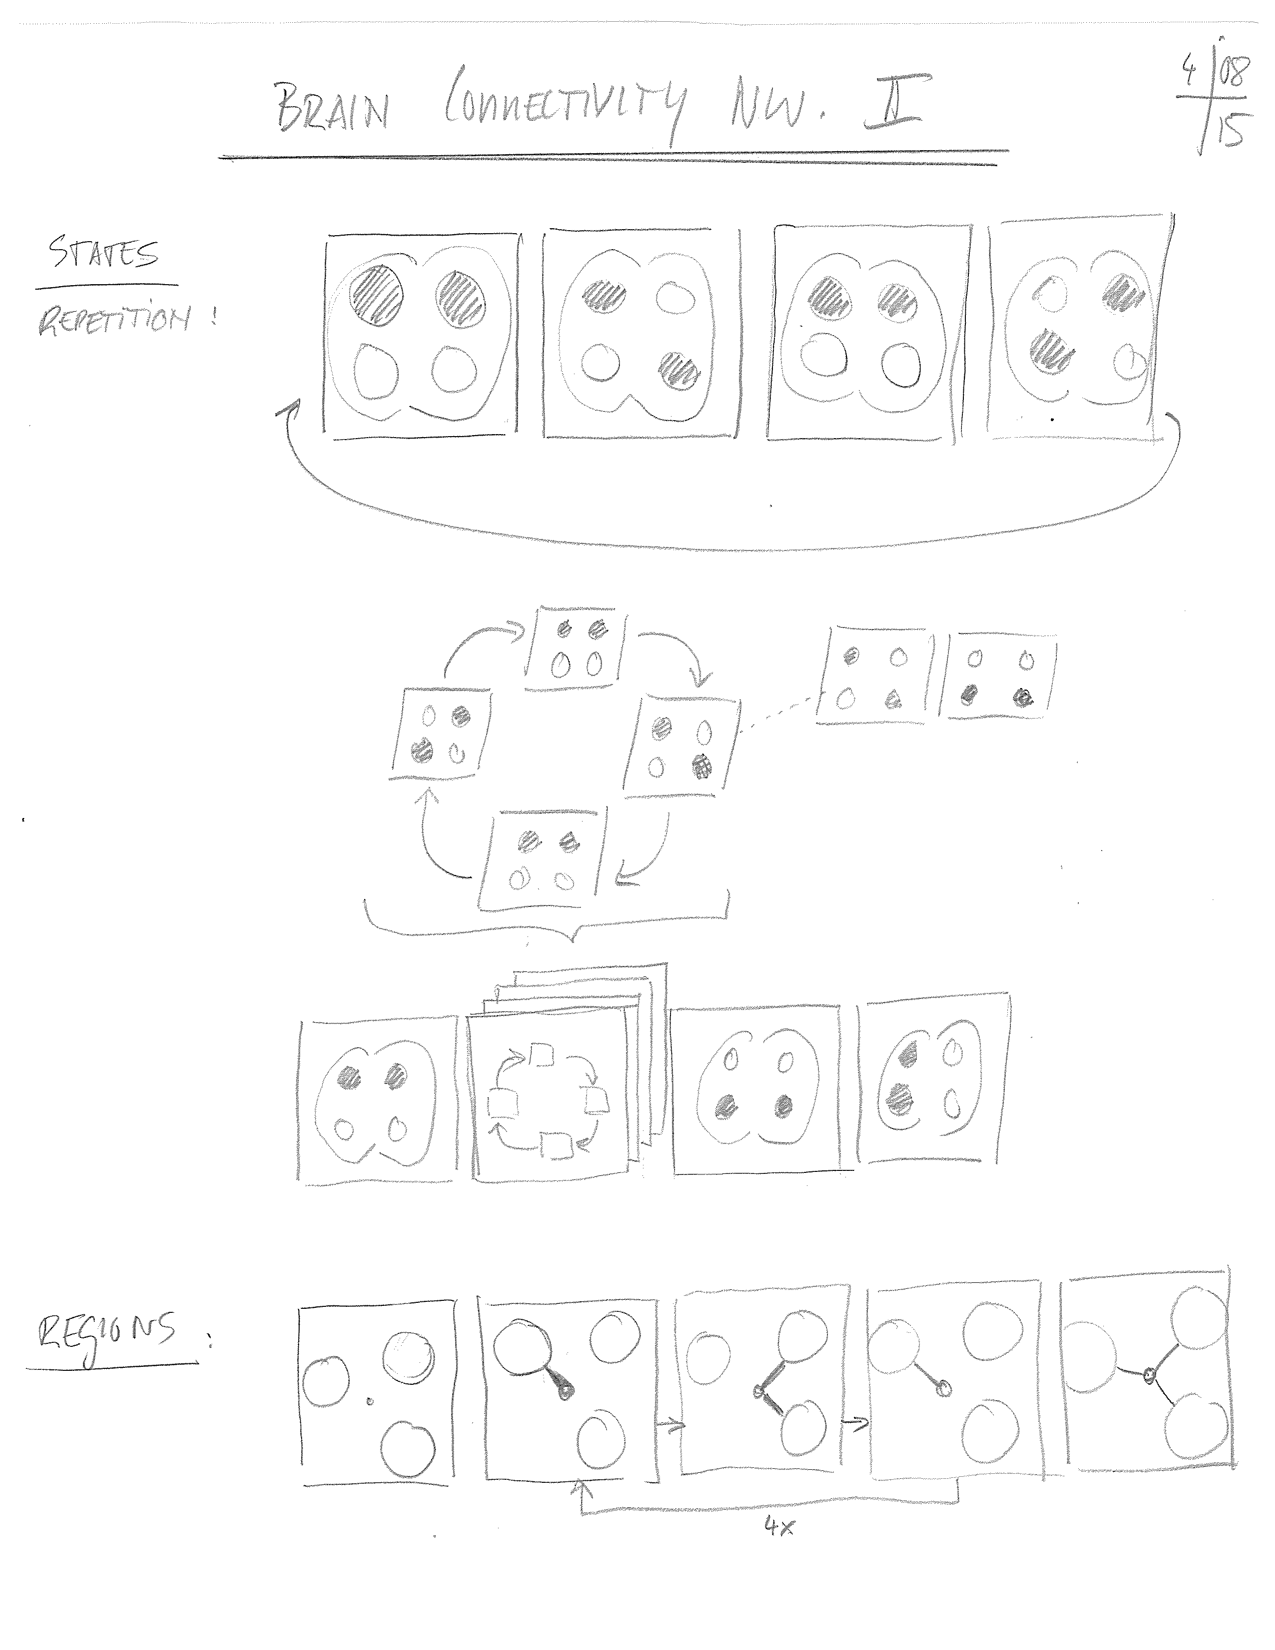
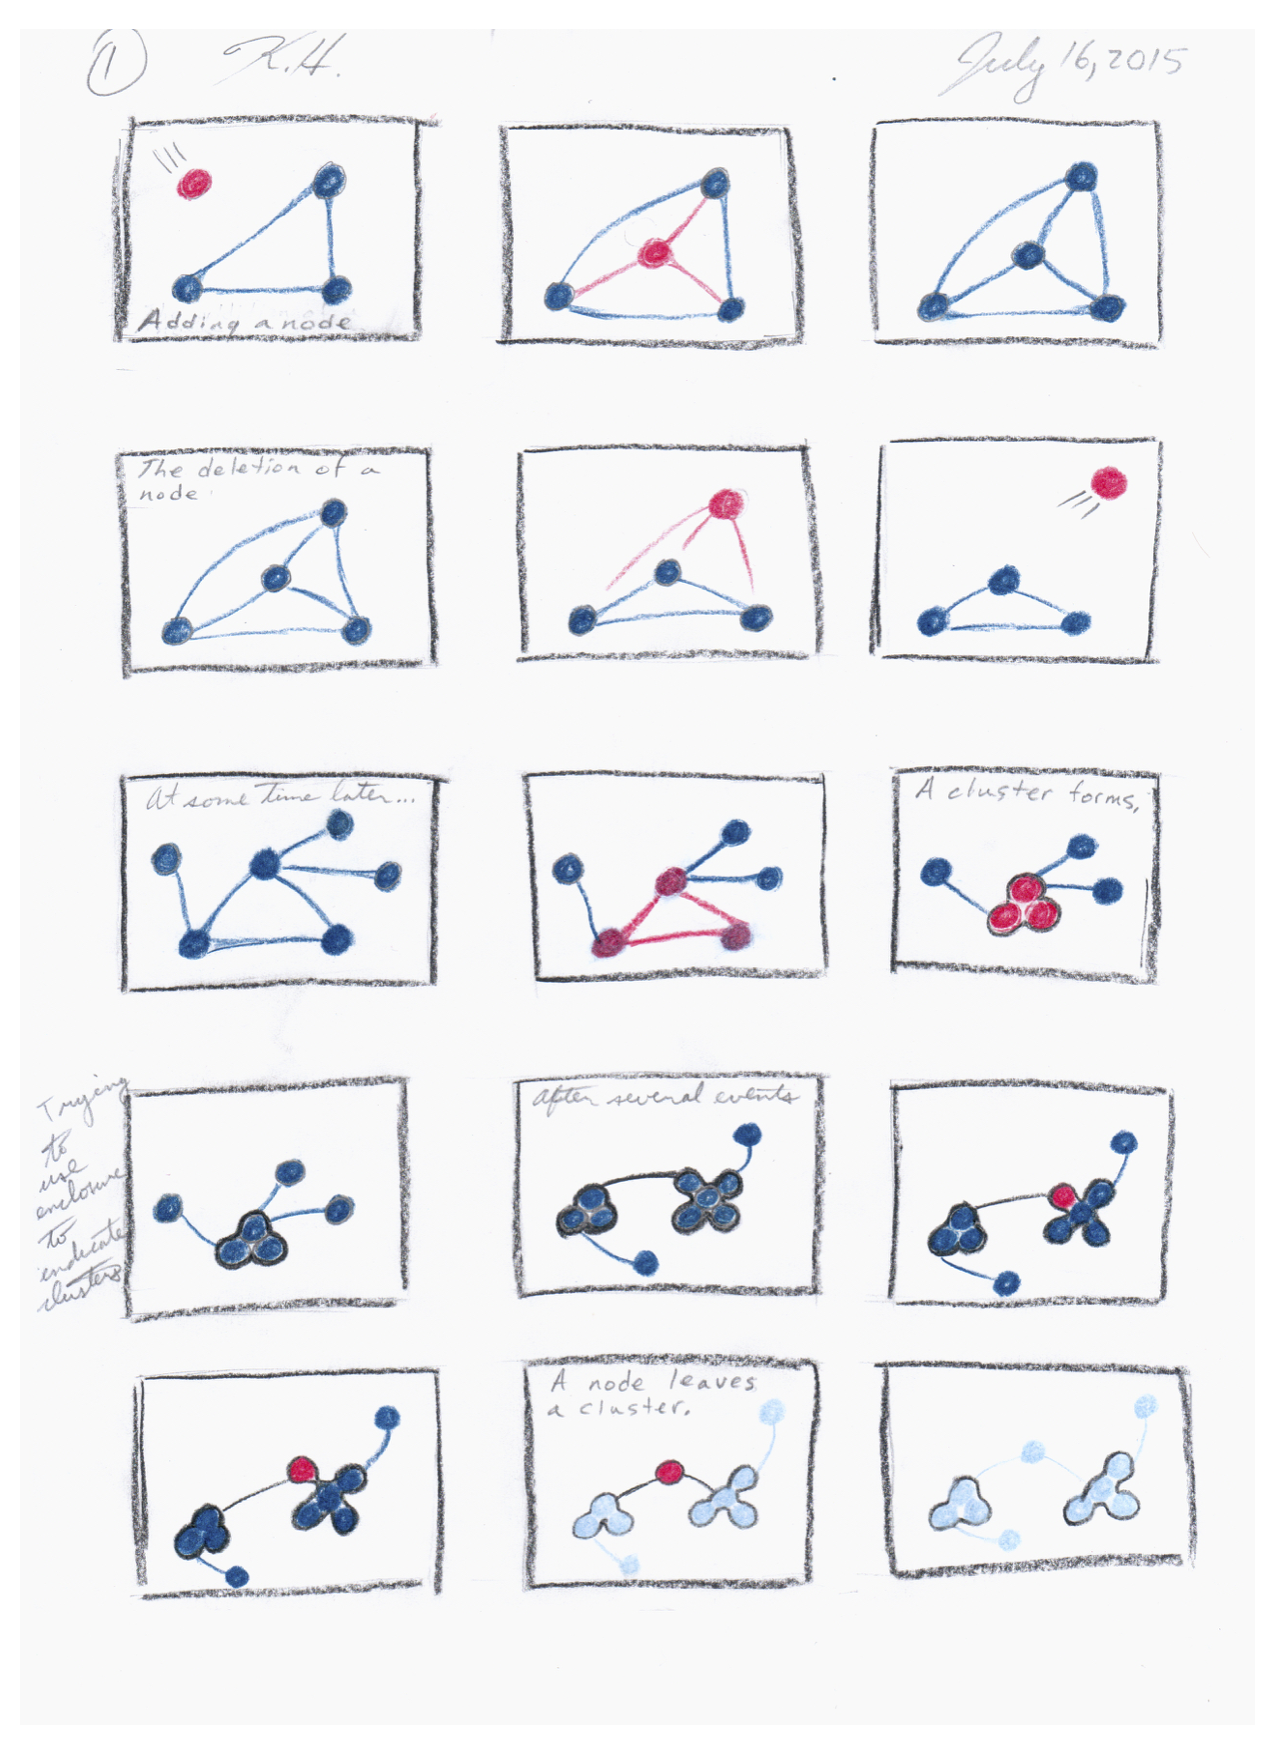
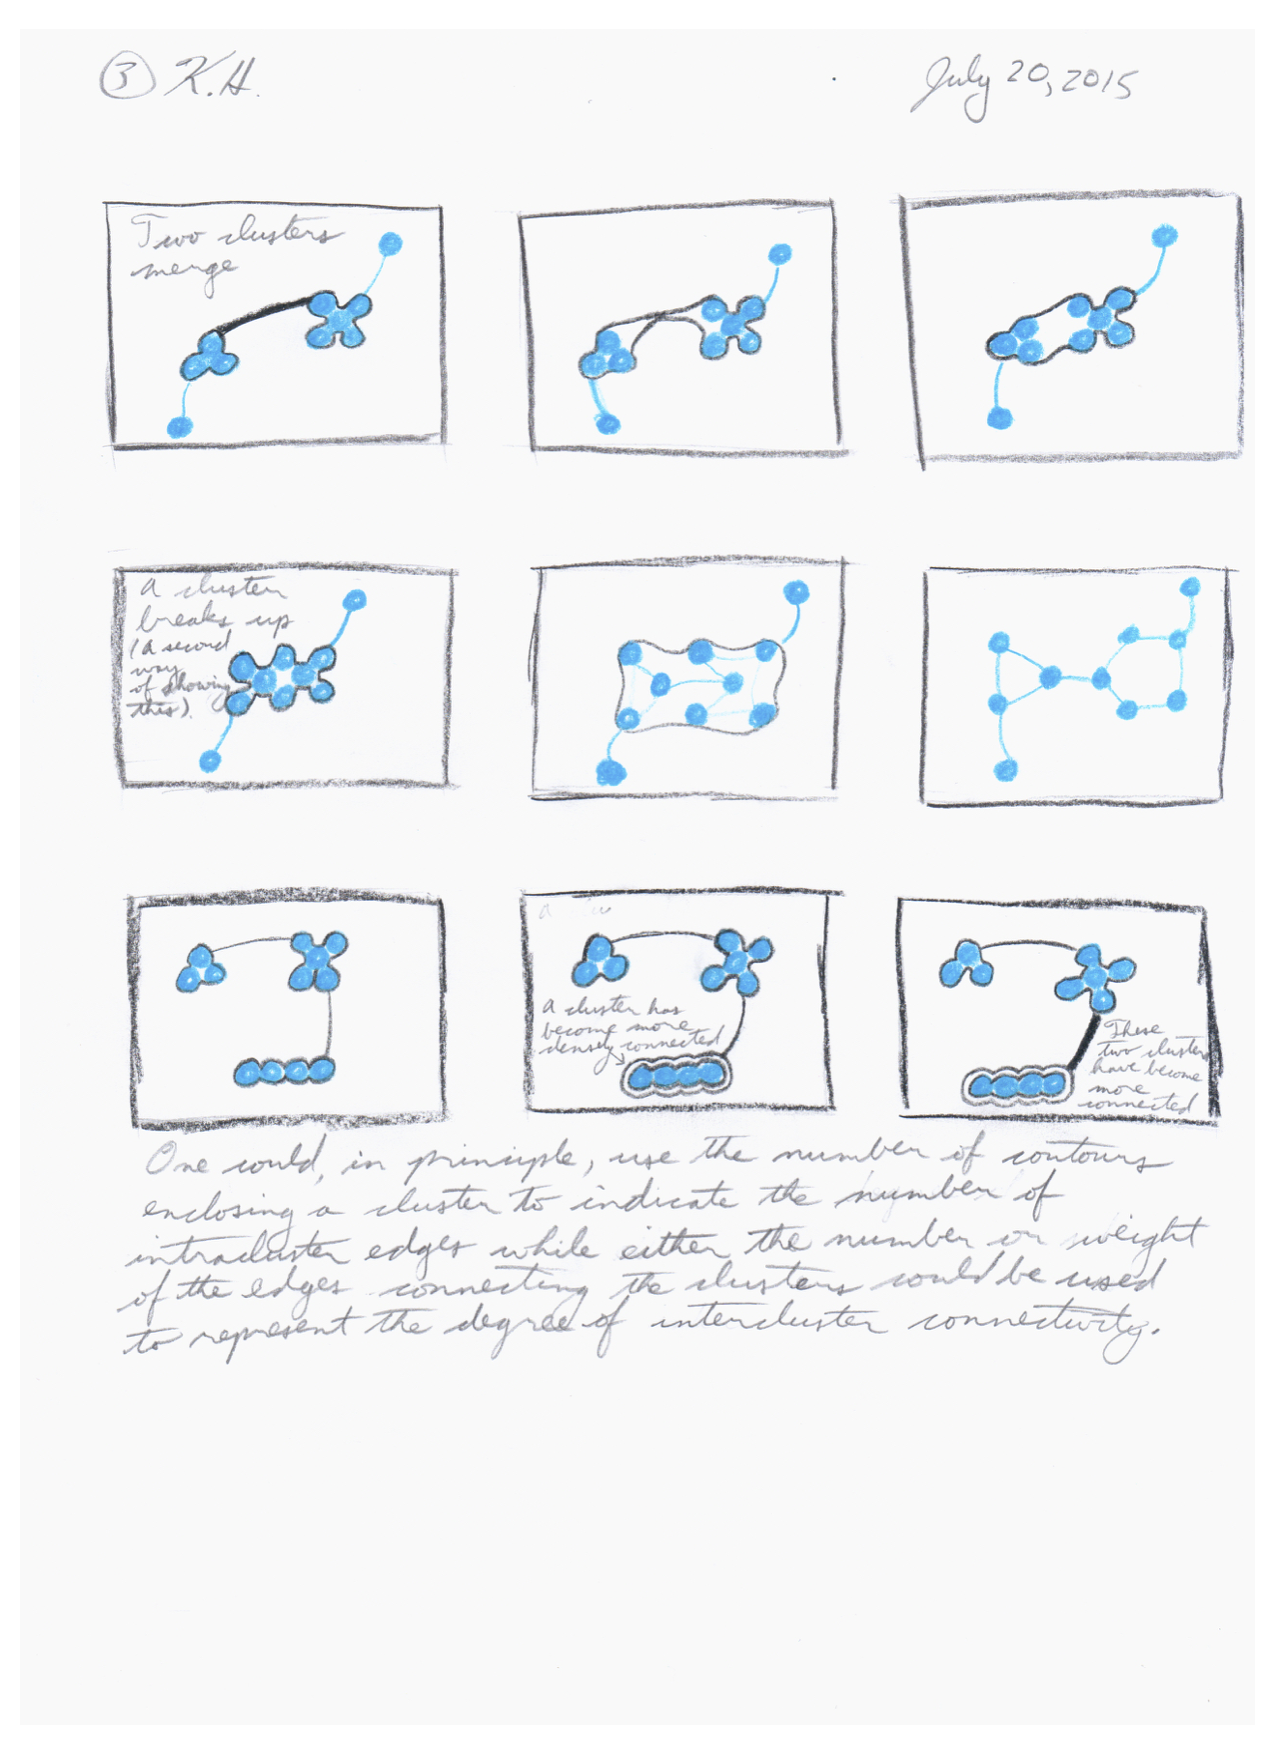
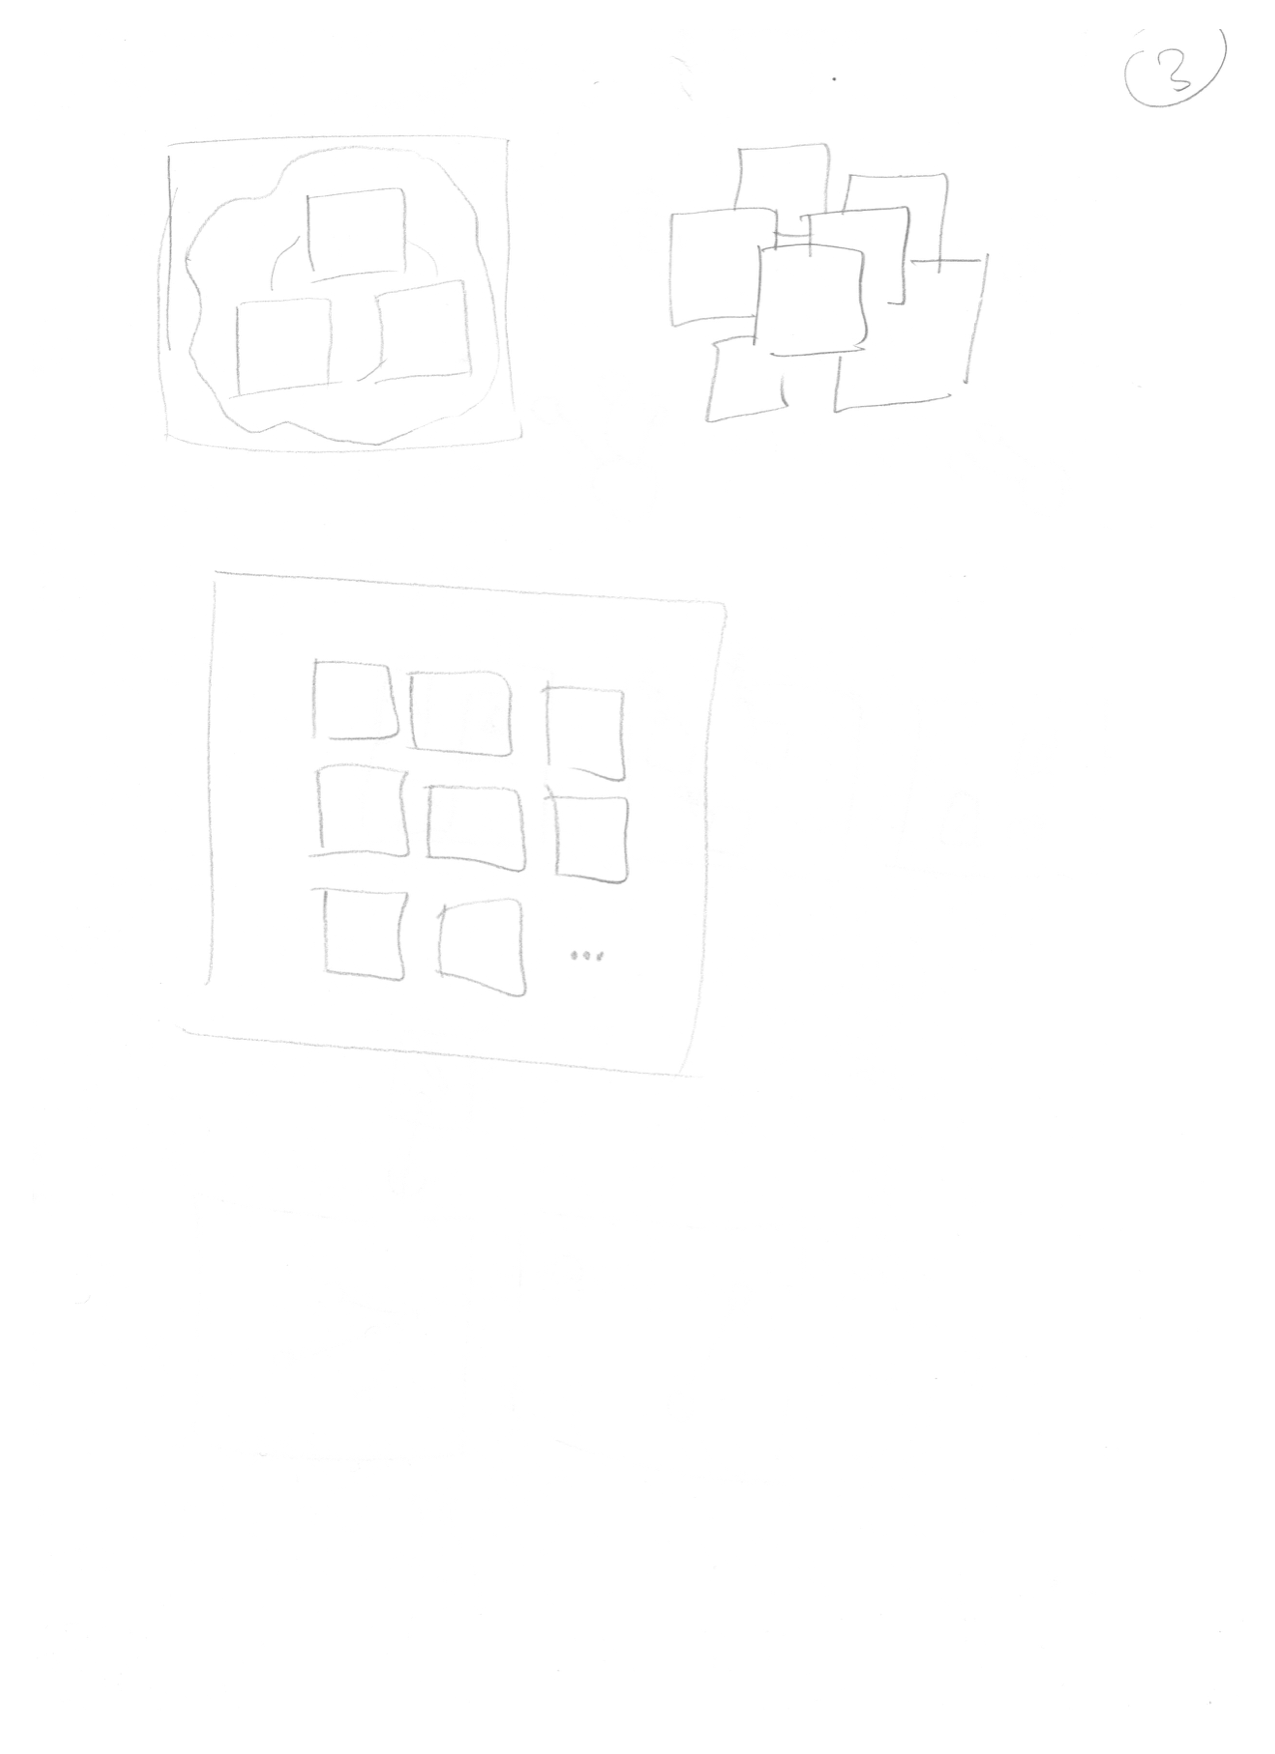
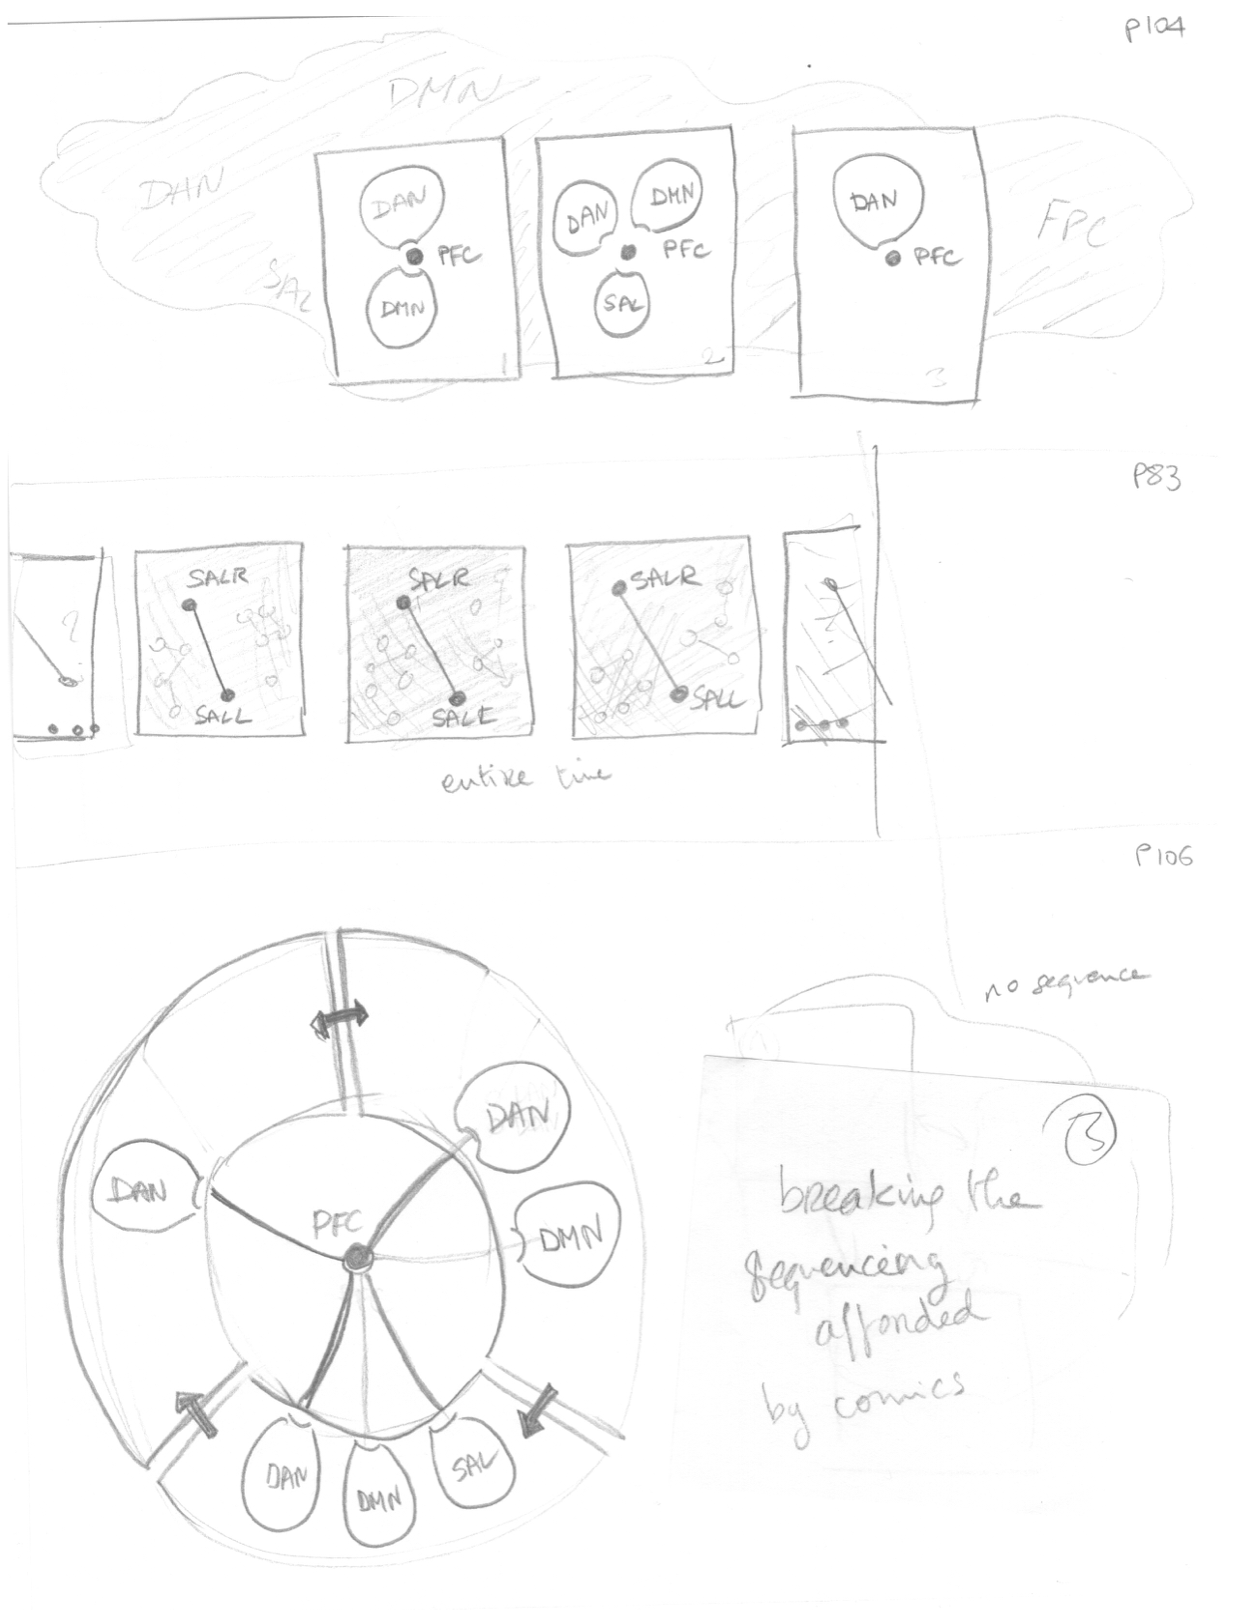
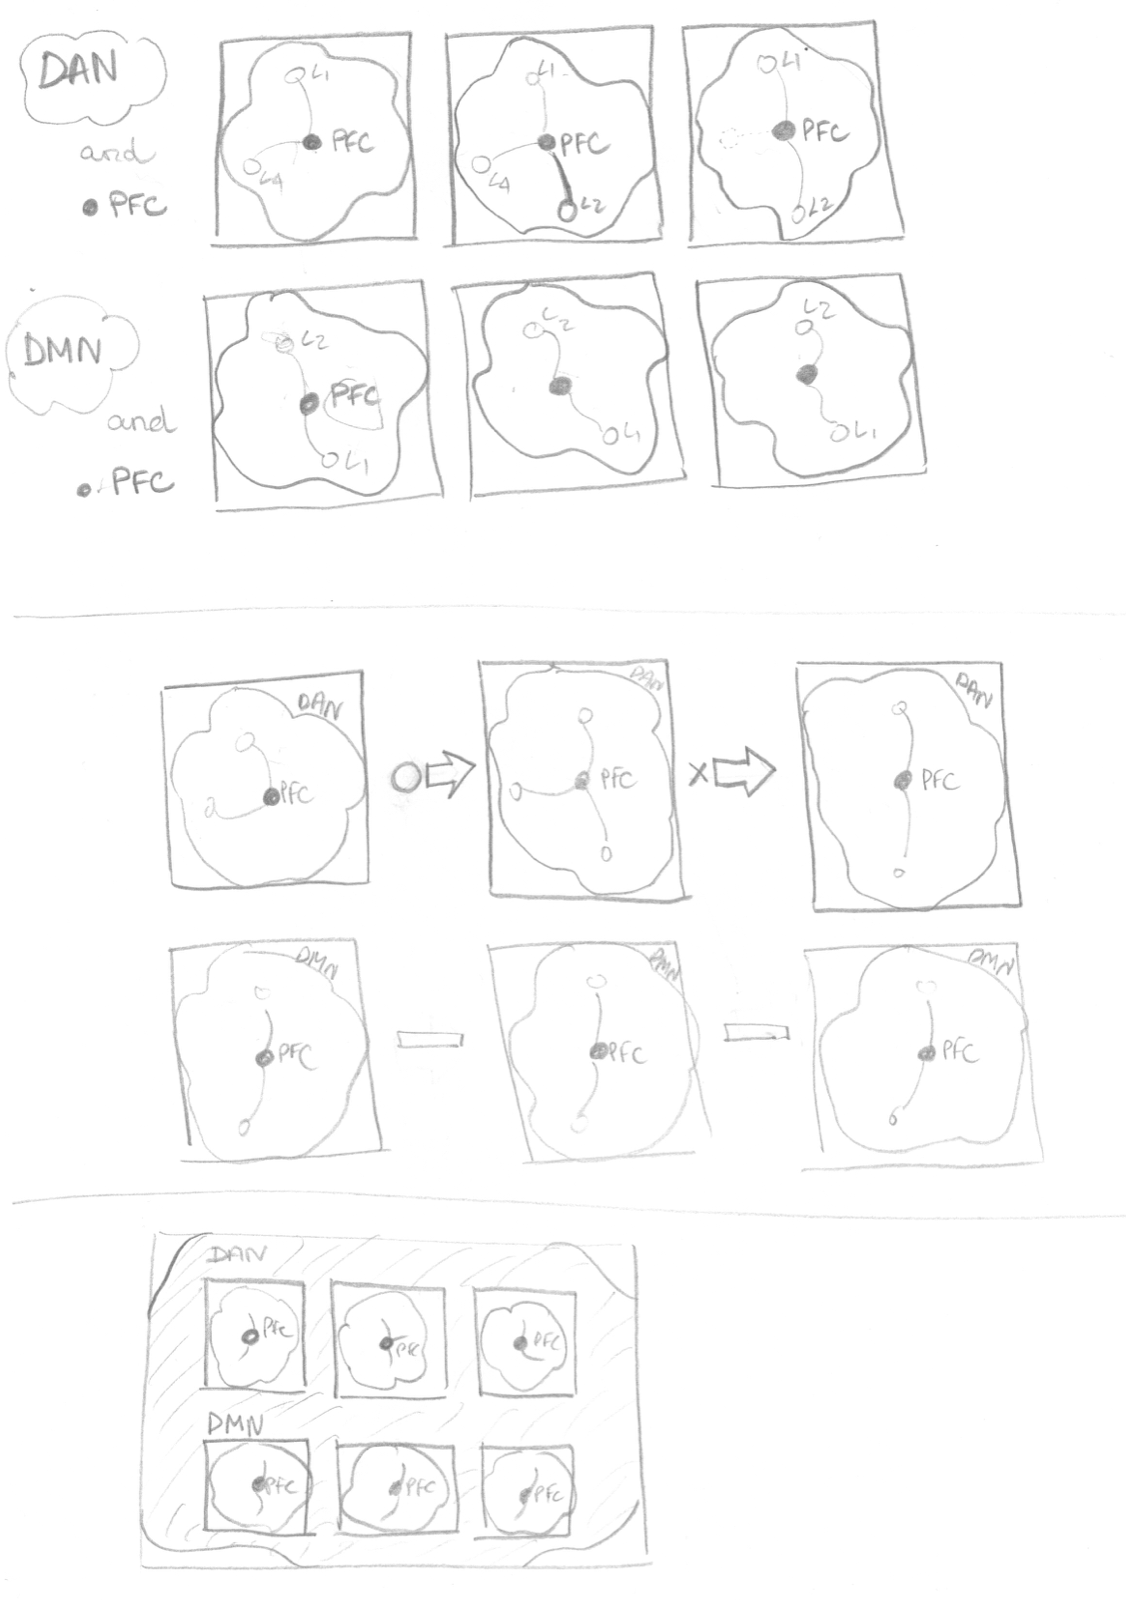
3. Design Space: To check for coverage of graph changes and the variety of graphical styles, we created a design space with 2 dimensions: a) graph objects and their changes and b) visual styles. A visual style was defined as a consistent set of graphical rules to depict changes, e.g. arrows to indicate direction of movement, dashed lines to indicate object removal, bold lines to indicate object appearance, etc.
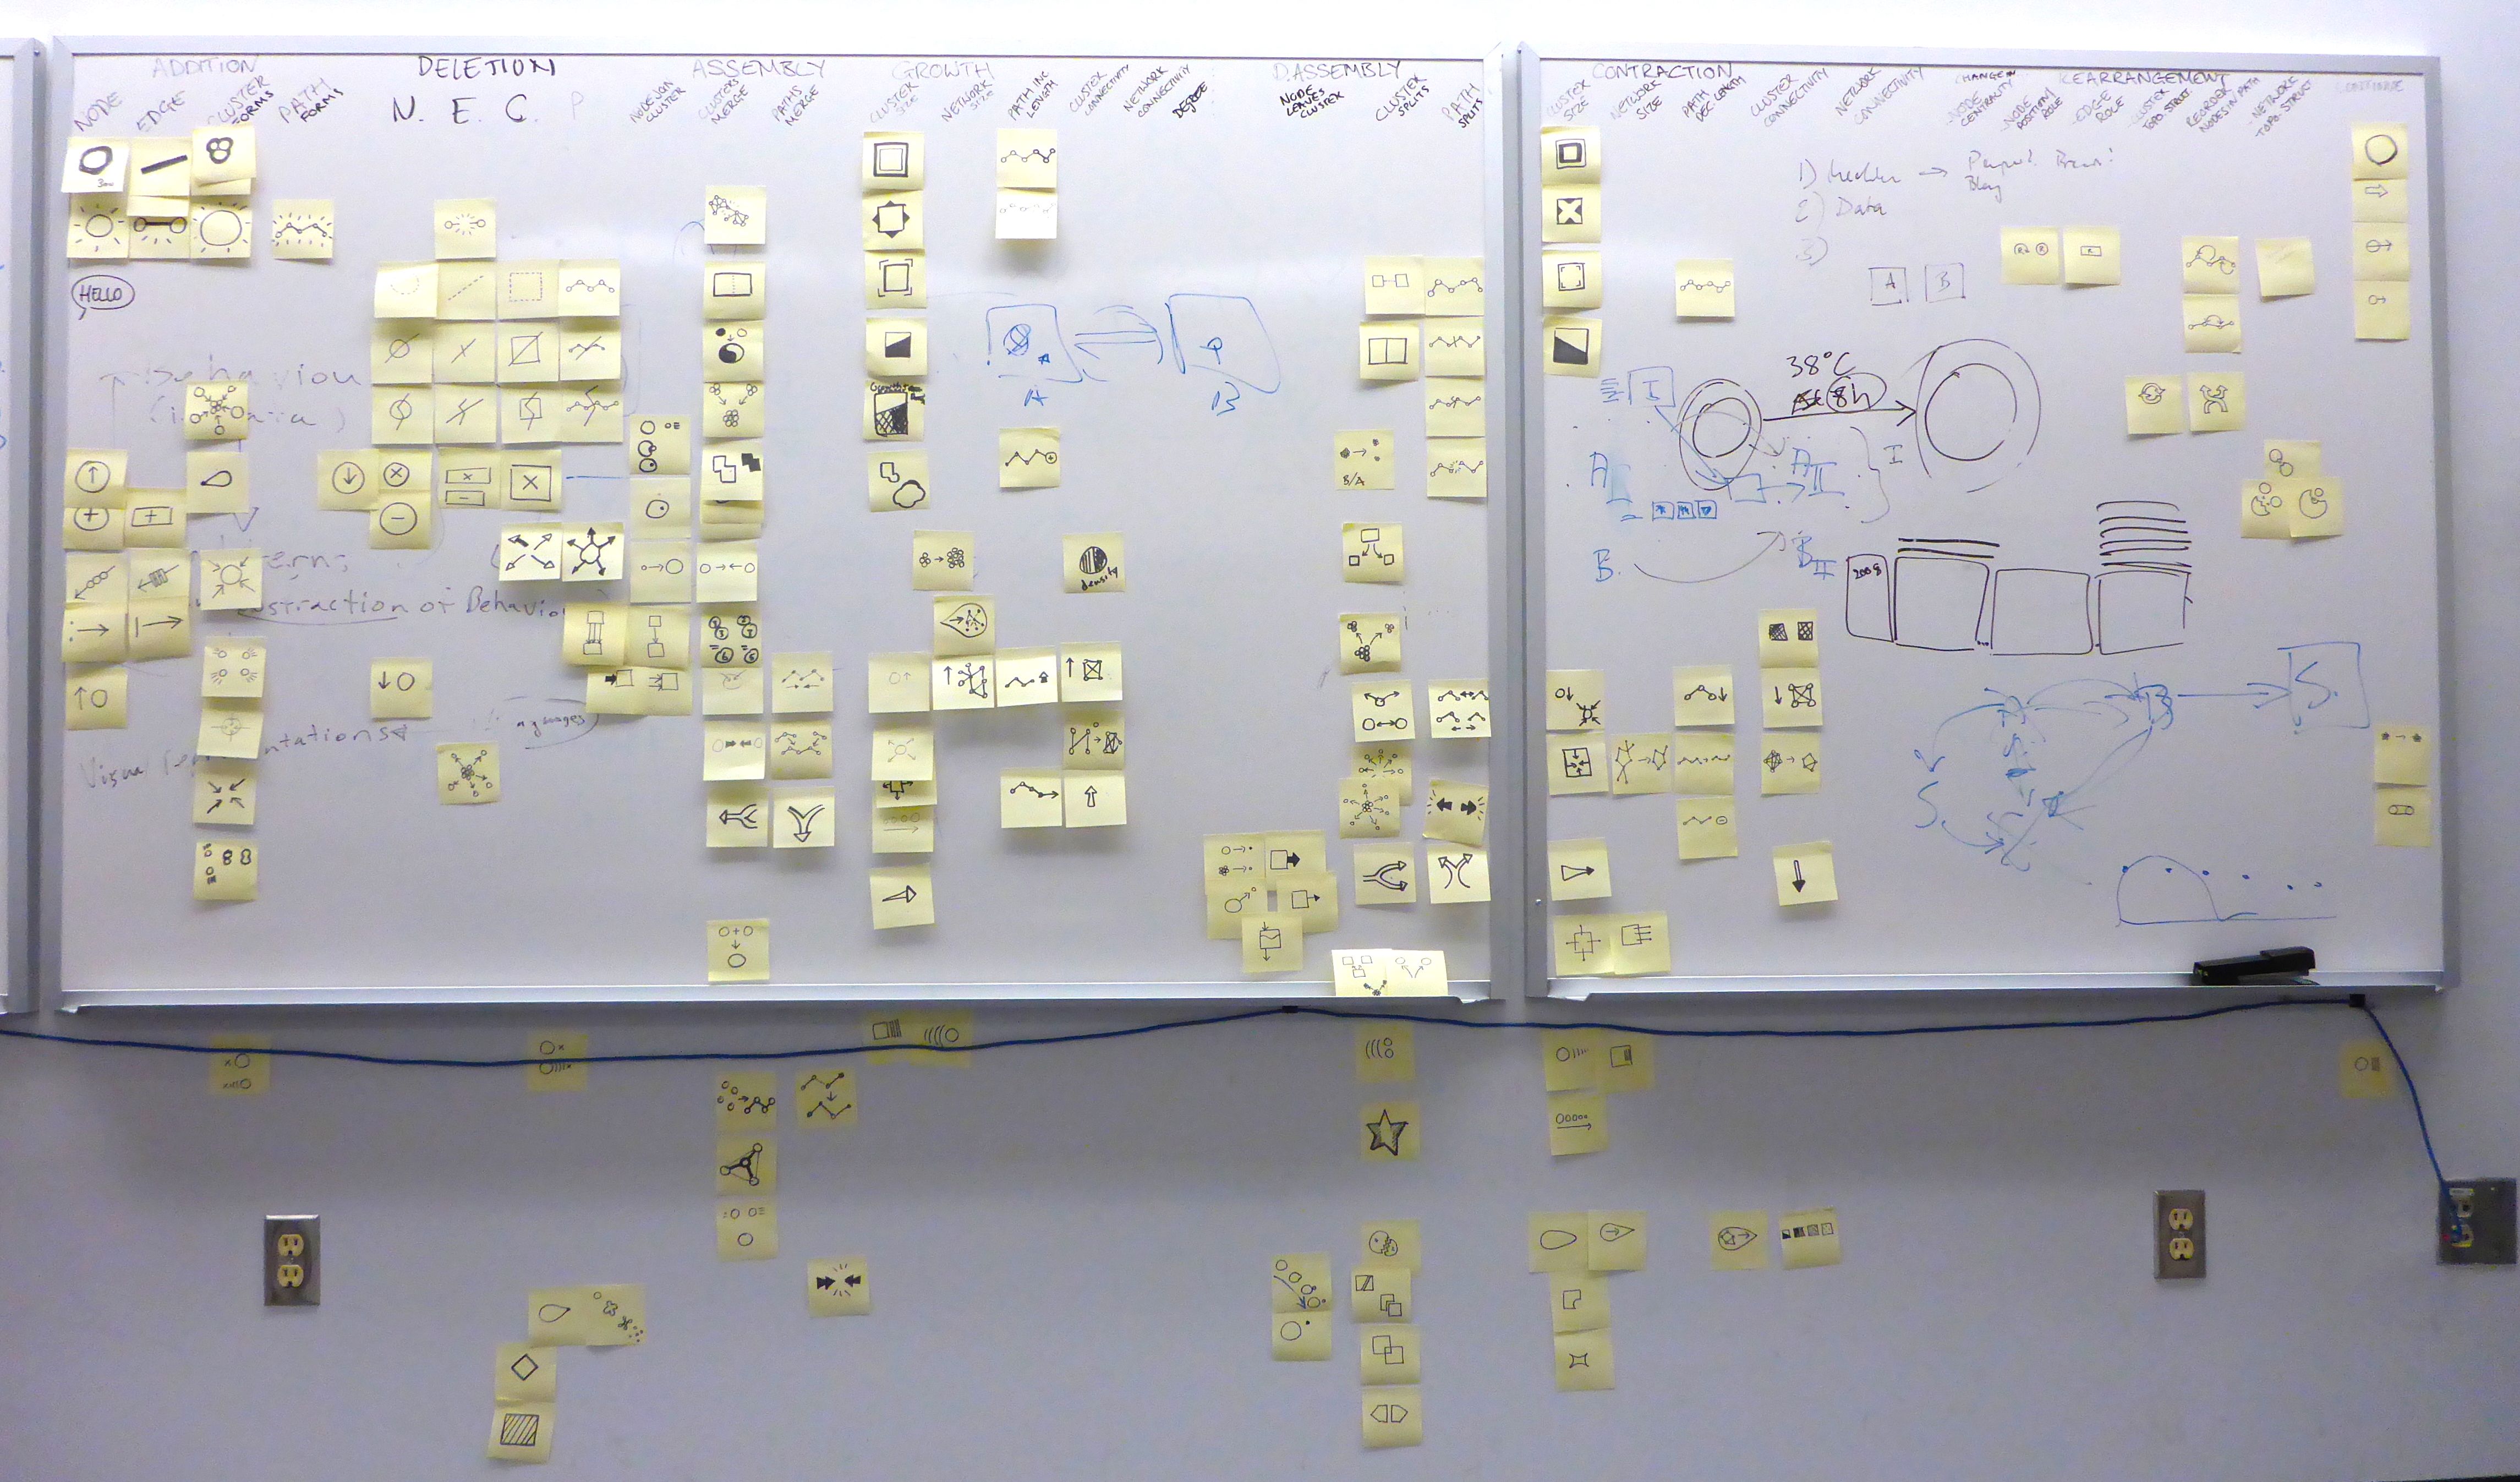
From this design space we tried to consistently apply our visual styles to cover as many of the graph changes as possible. However, a visual style did not need to cover all graph changes. More important, we wanted to know which combination of styles allowed the most coverage, while not confounding the graphical rules of the respective styles. For example, a graphical style that used dashed lines to indicate object removal is inconsistent with any visual style that uses dashed lines to indicate object appearance. Similar, the same style that uses dashed lines to indicate object removal, is inconsistent with any styles that uses dashed lines for anything else than object removal, e.g. object appearance.
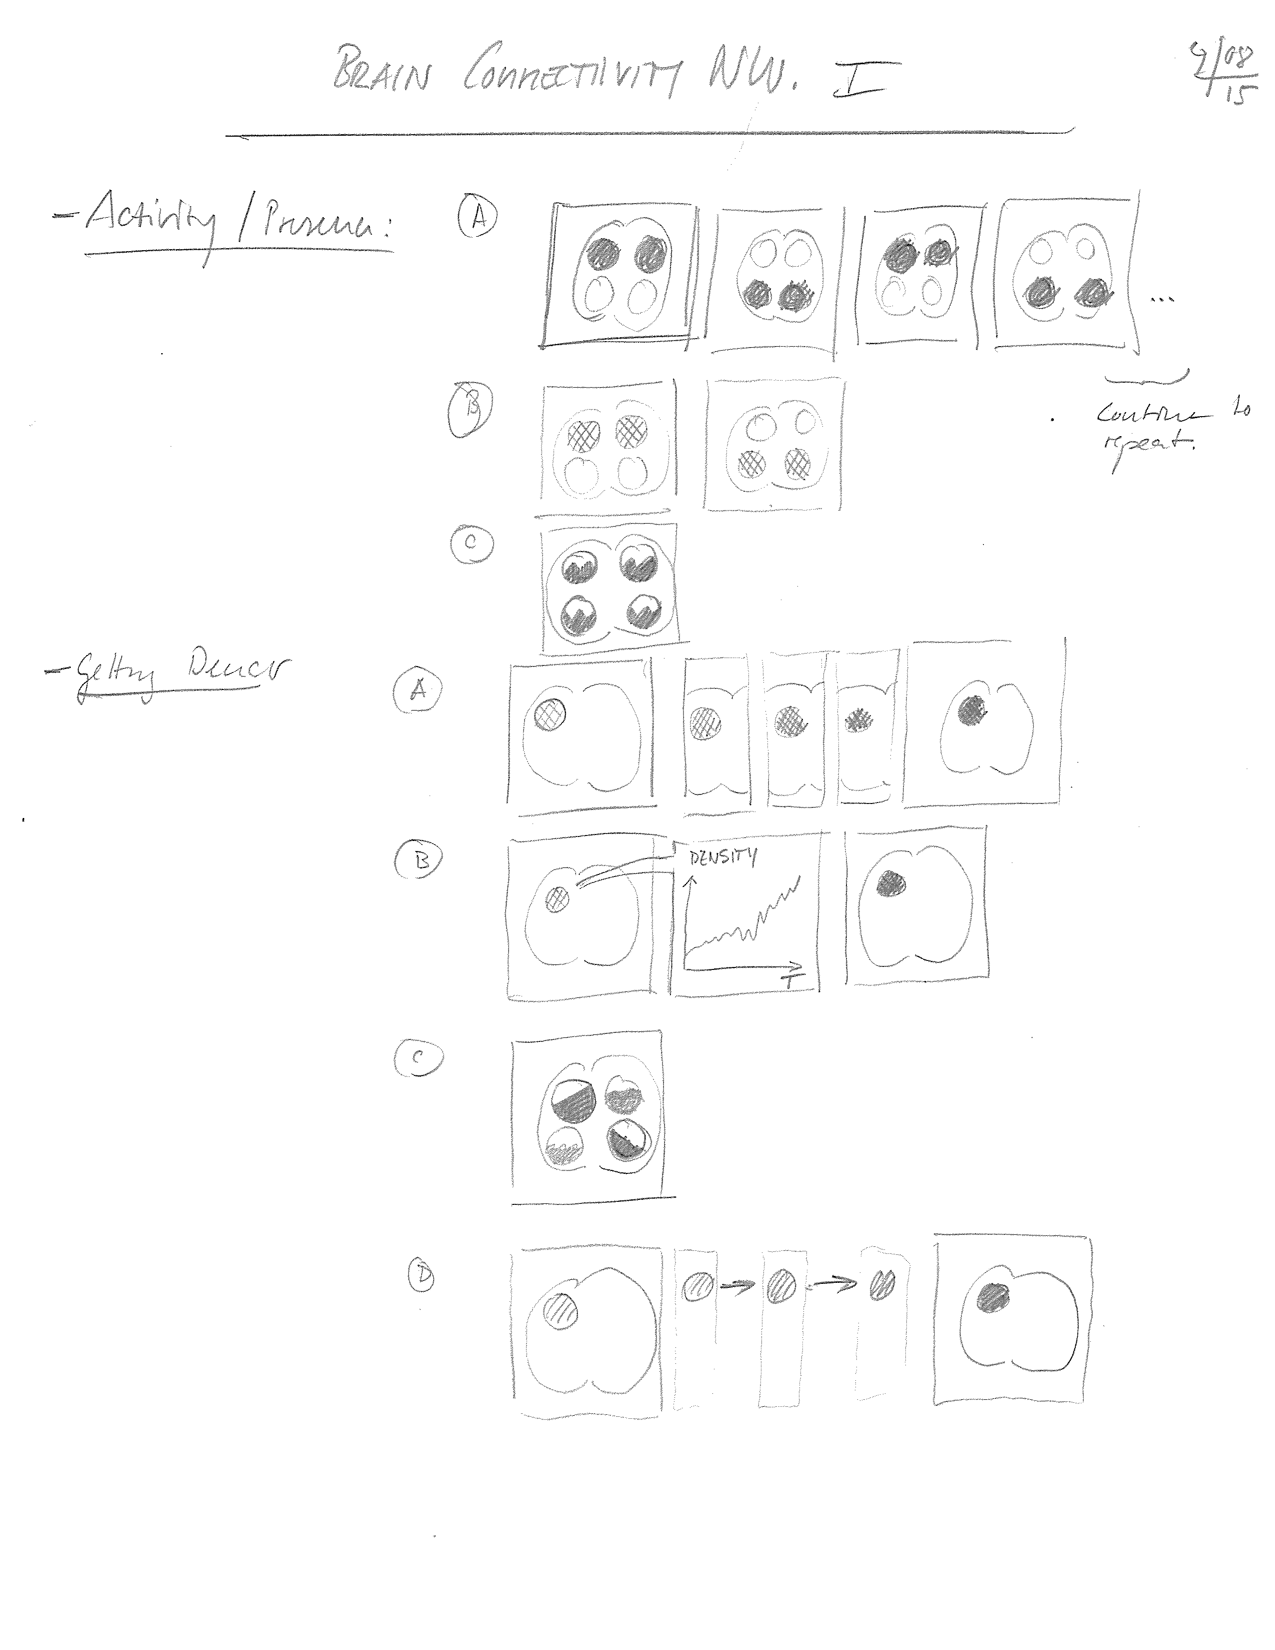
4. Creating Comics: Using our design space and the visual styles that we found appropriate, each of the authors started by independently sketching comics for three types of stories: stories found in the scientific literature, in sociology and chemistry, the web, and stories that describe the evolution of research groups familiar to the authors. Comics where sketched exclusively by hand in order to not introduce technical contains by using a computer. Discussing the resulting comics, we started formulating our factors-to-onsider as well as the design solutions we employed in our comics. With this initial rule set, we kept iterating over the comics and refined the factors. After several iterations, we converged to 8 factors to consider.
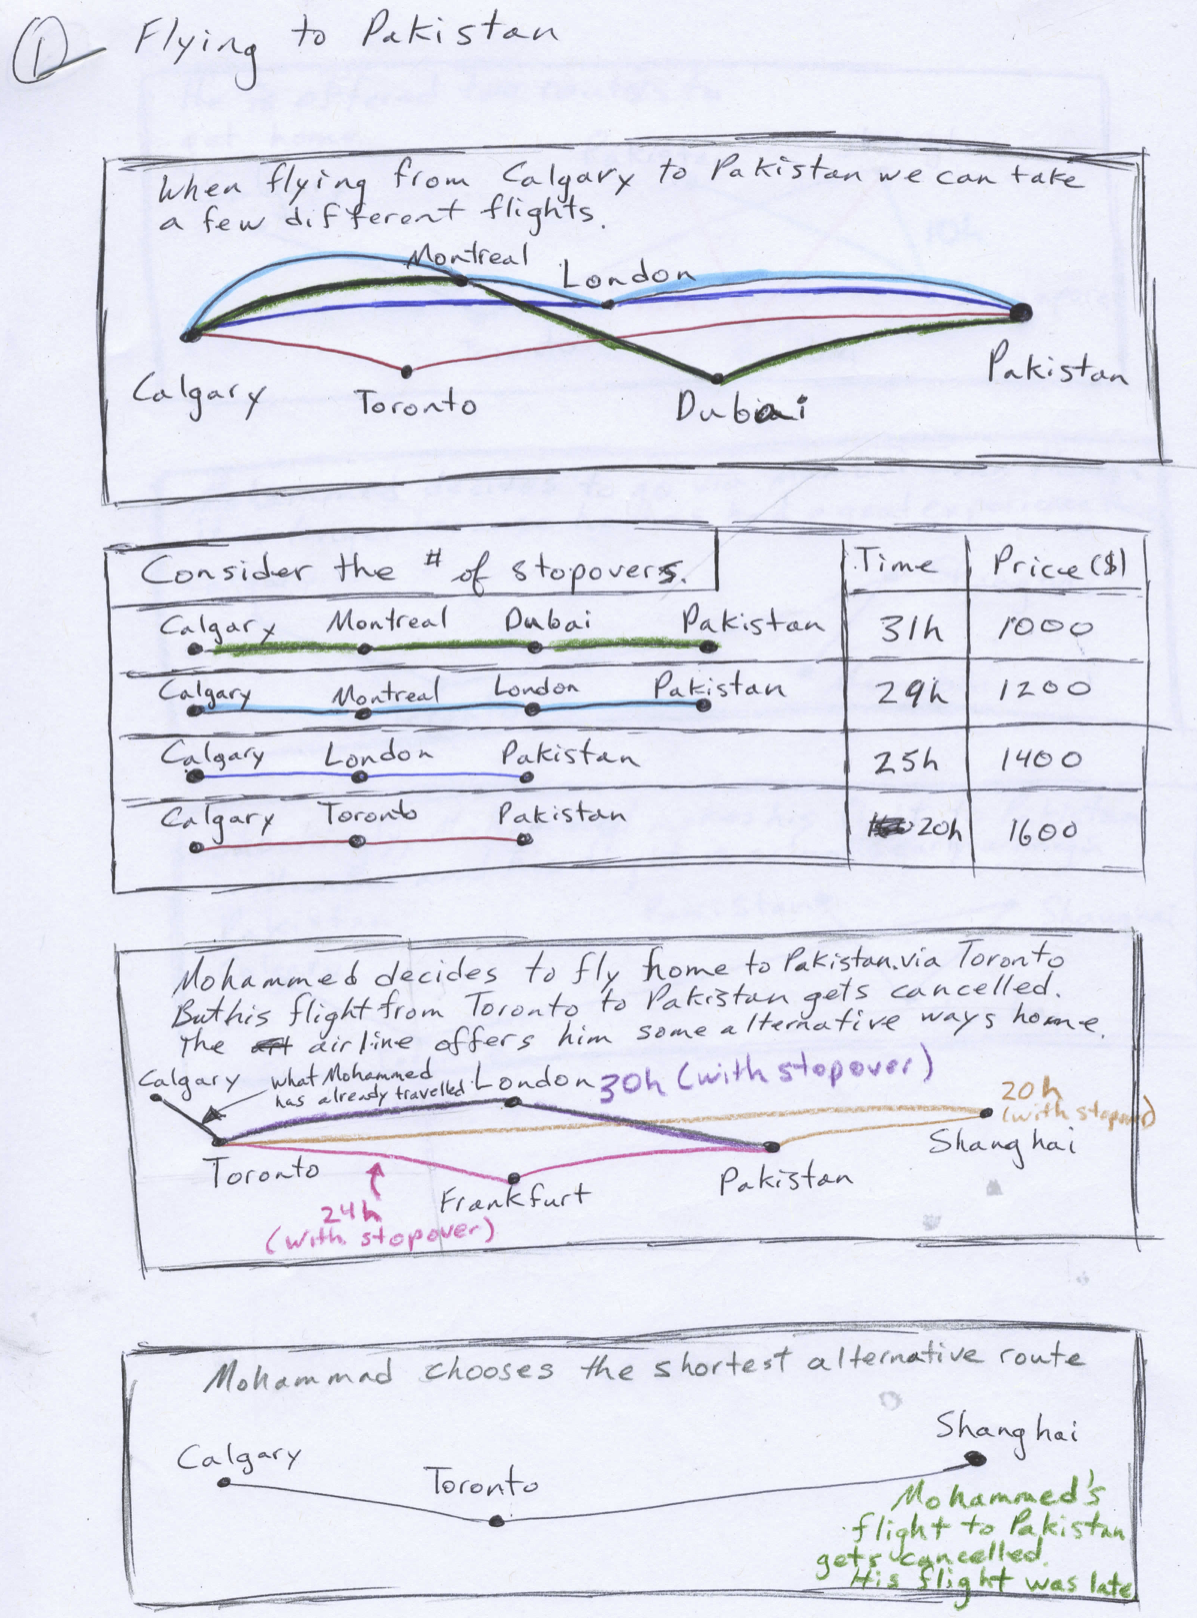
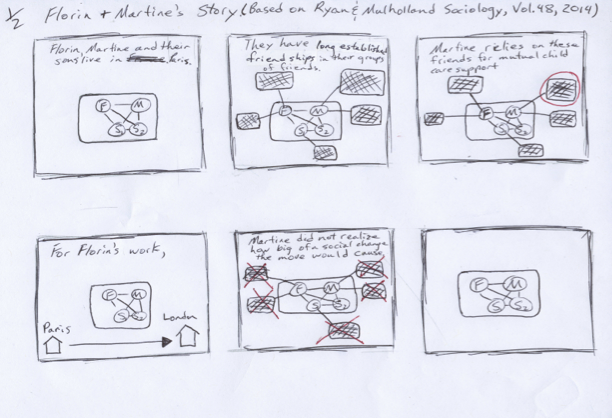
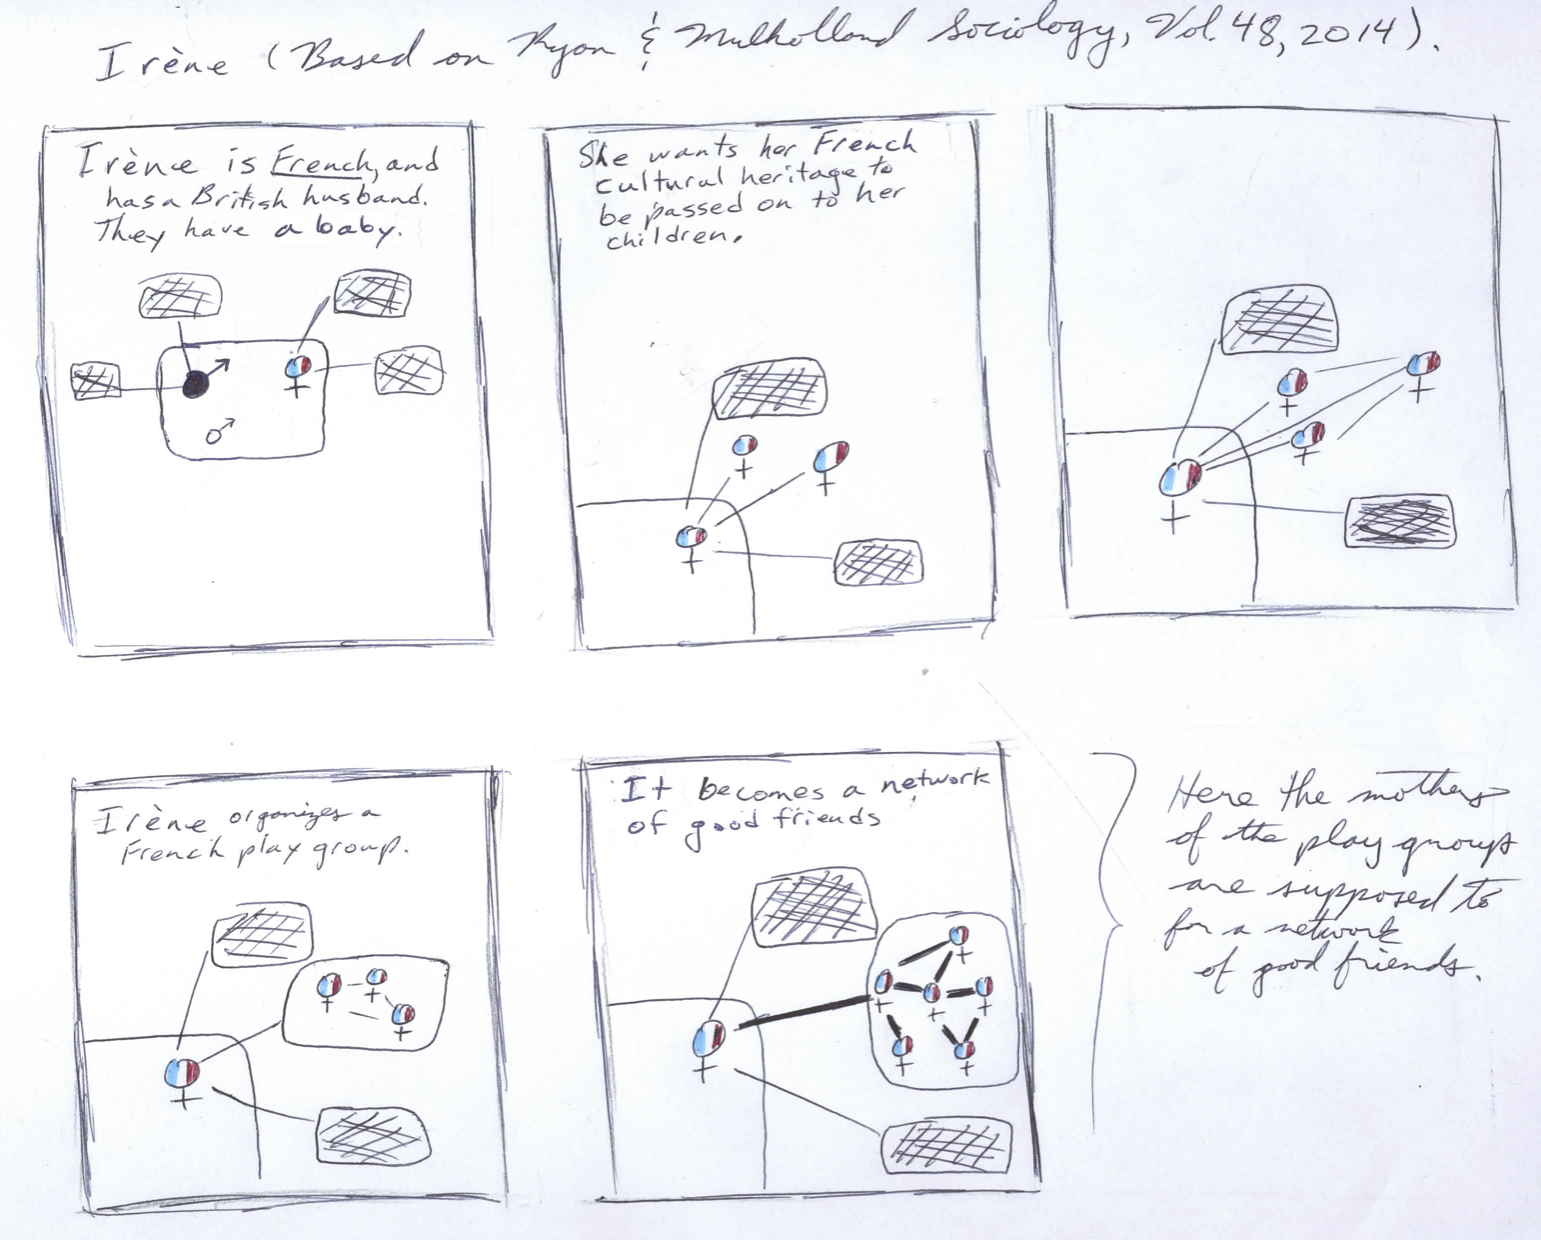
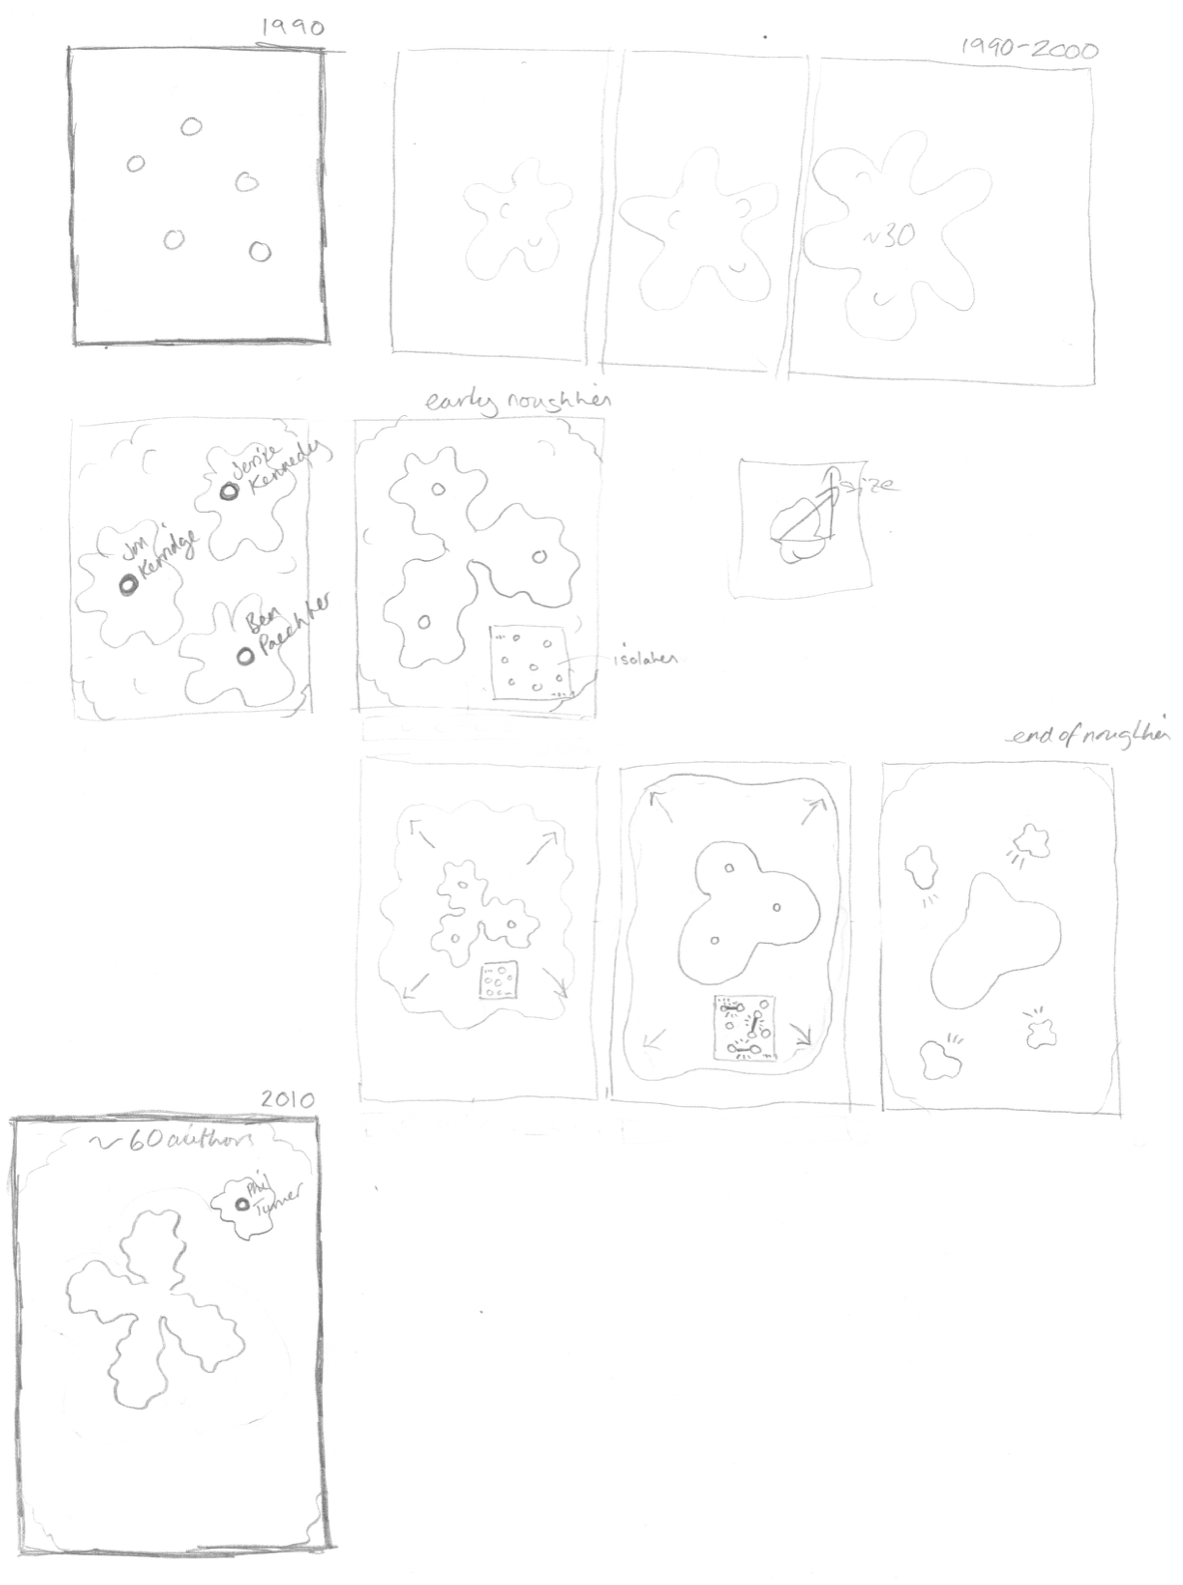
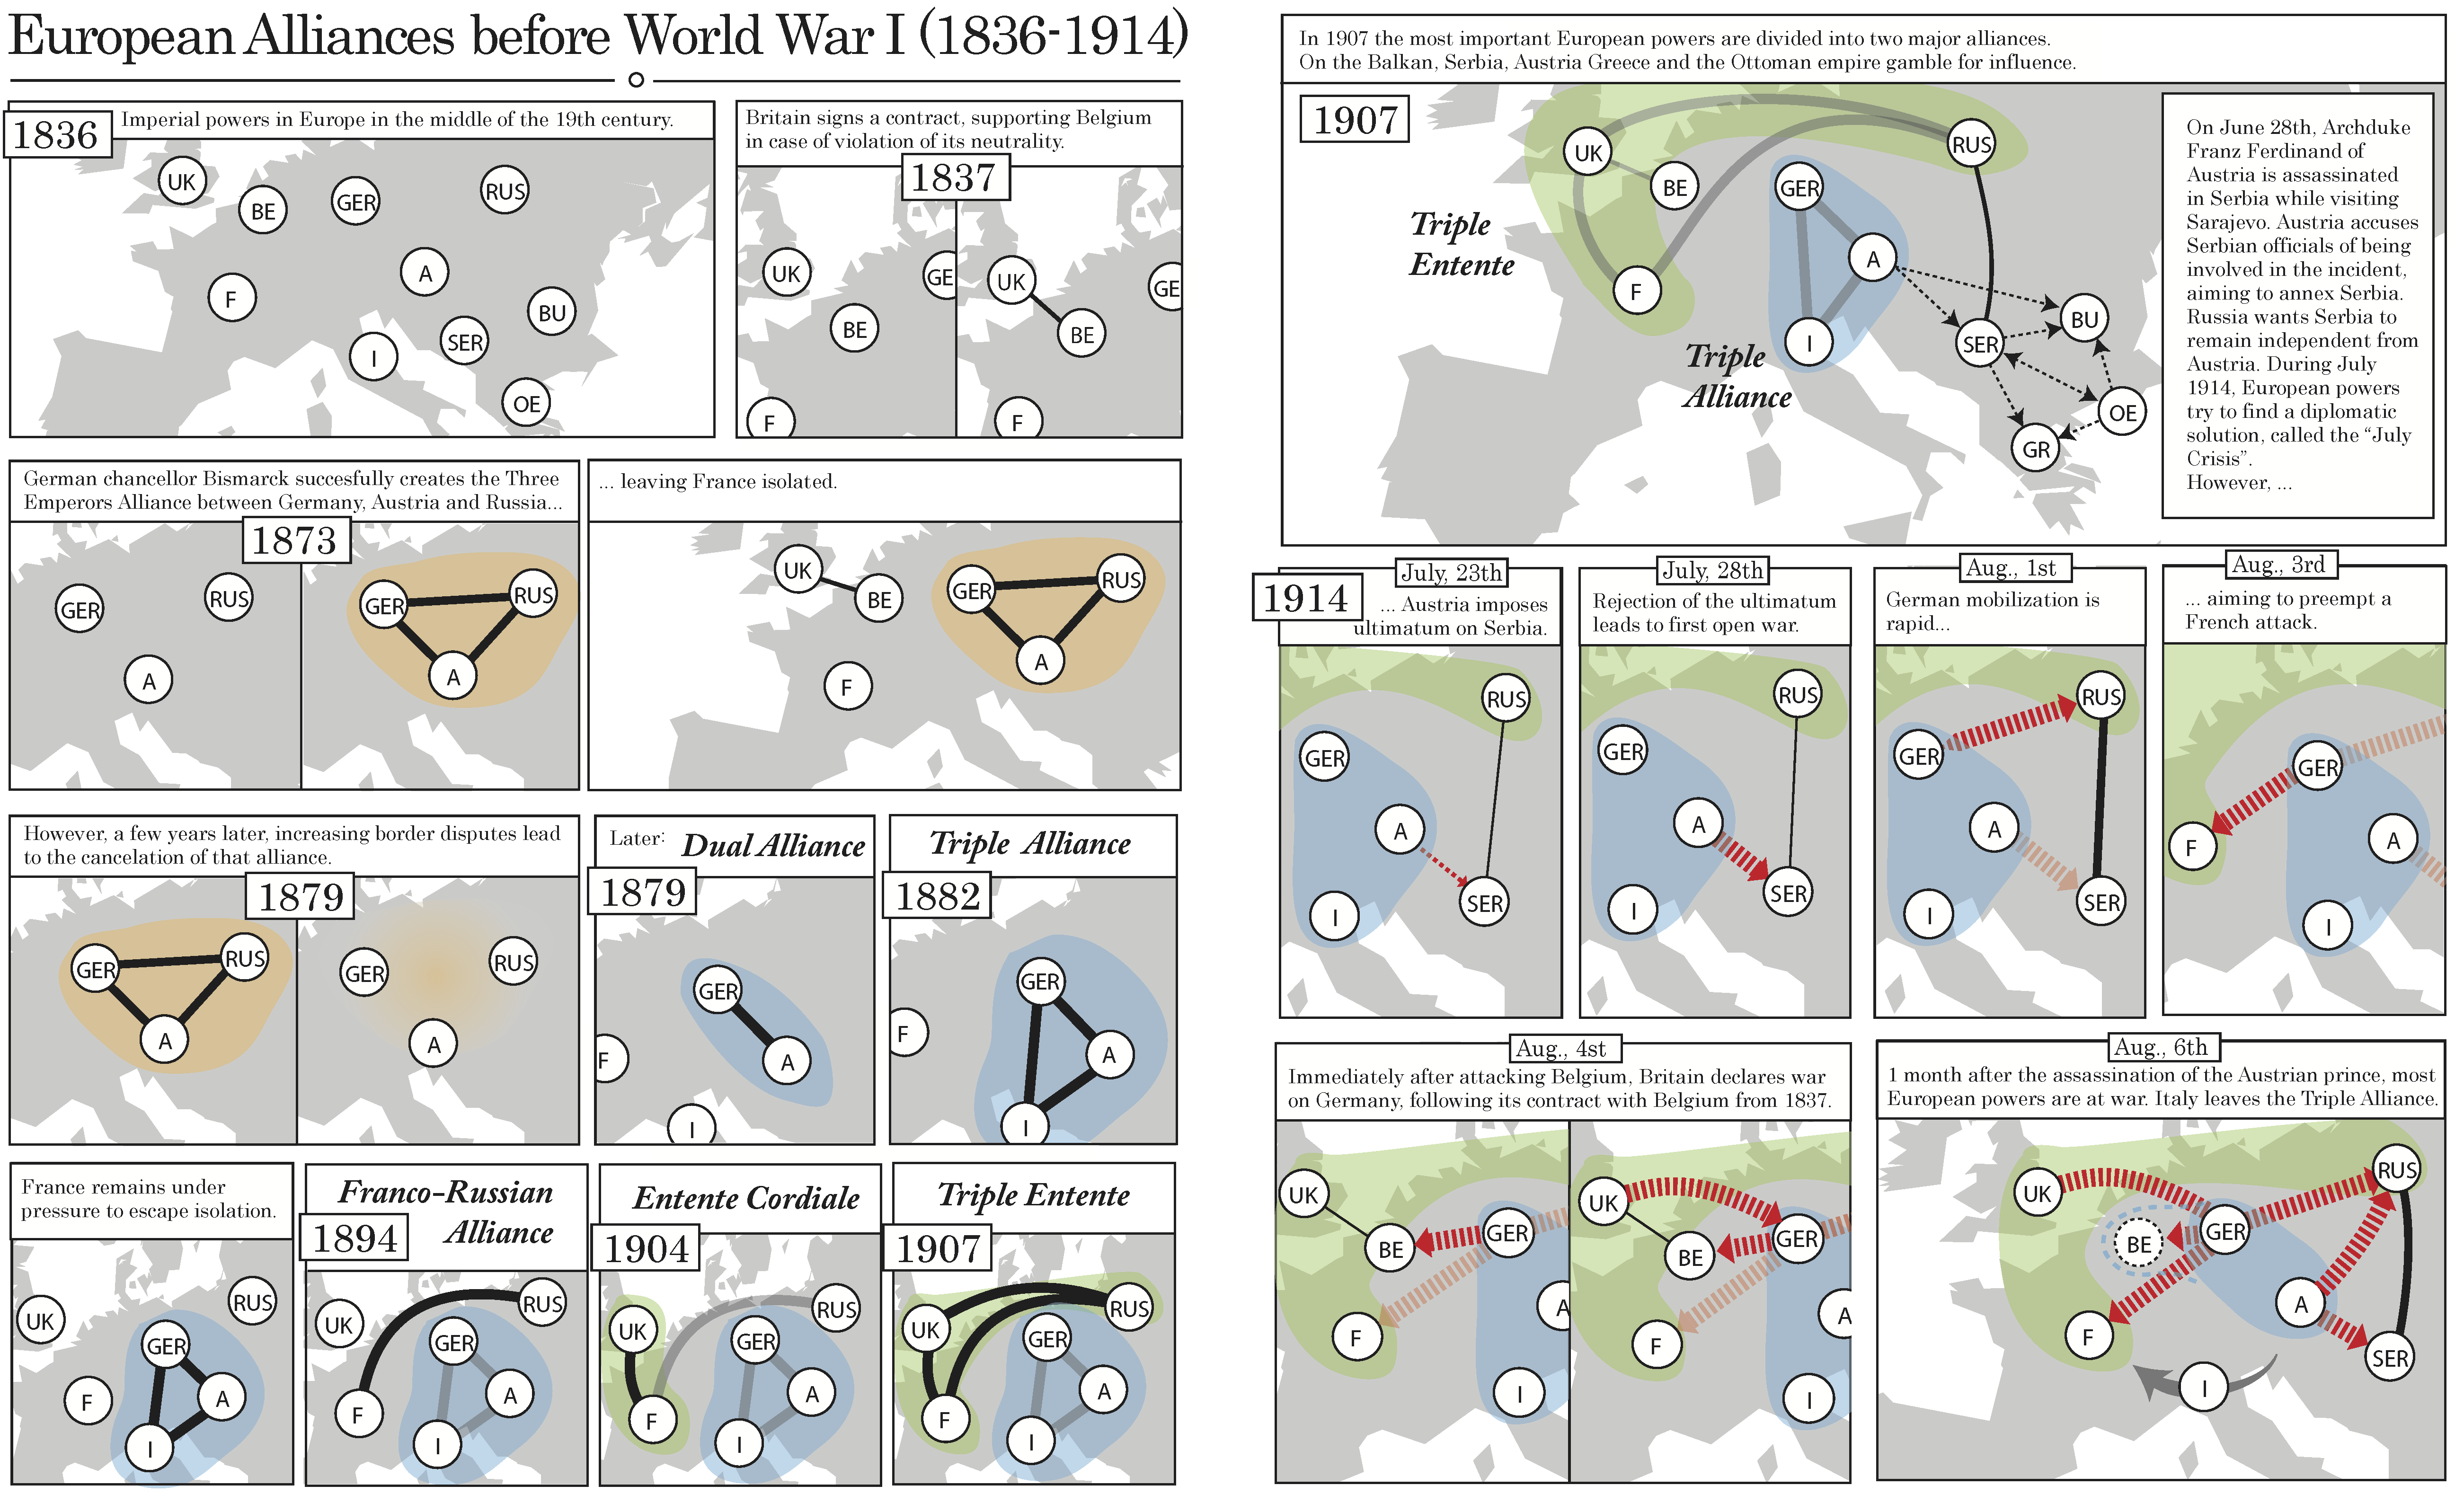
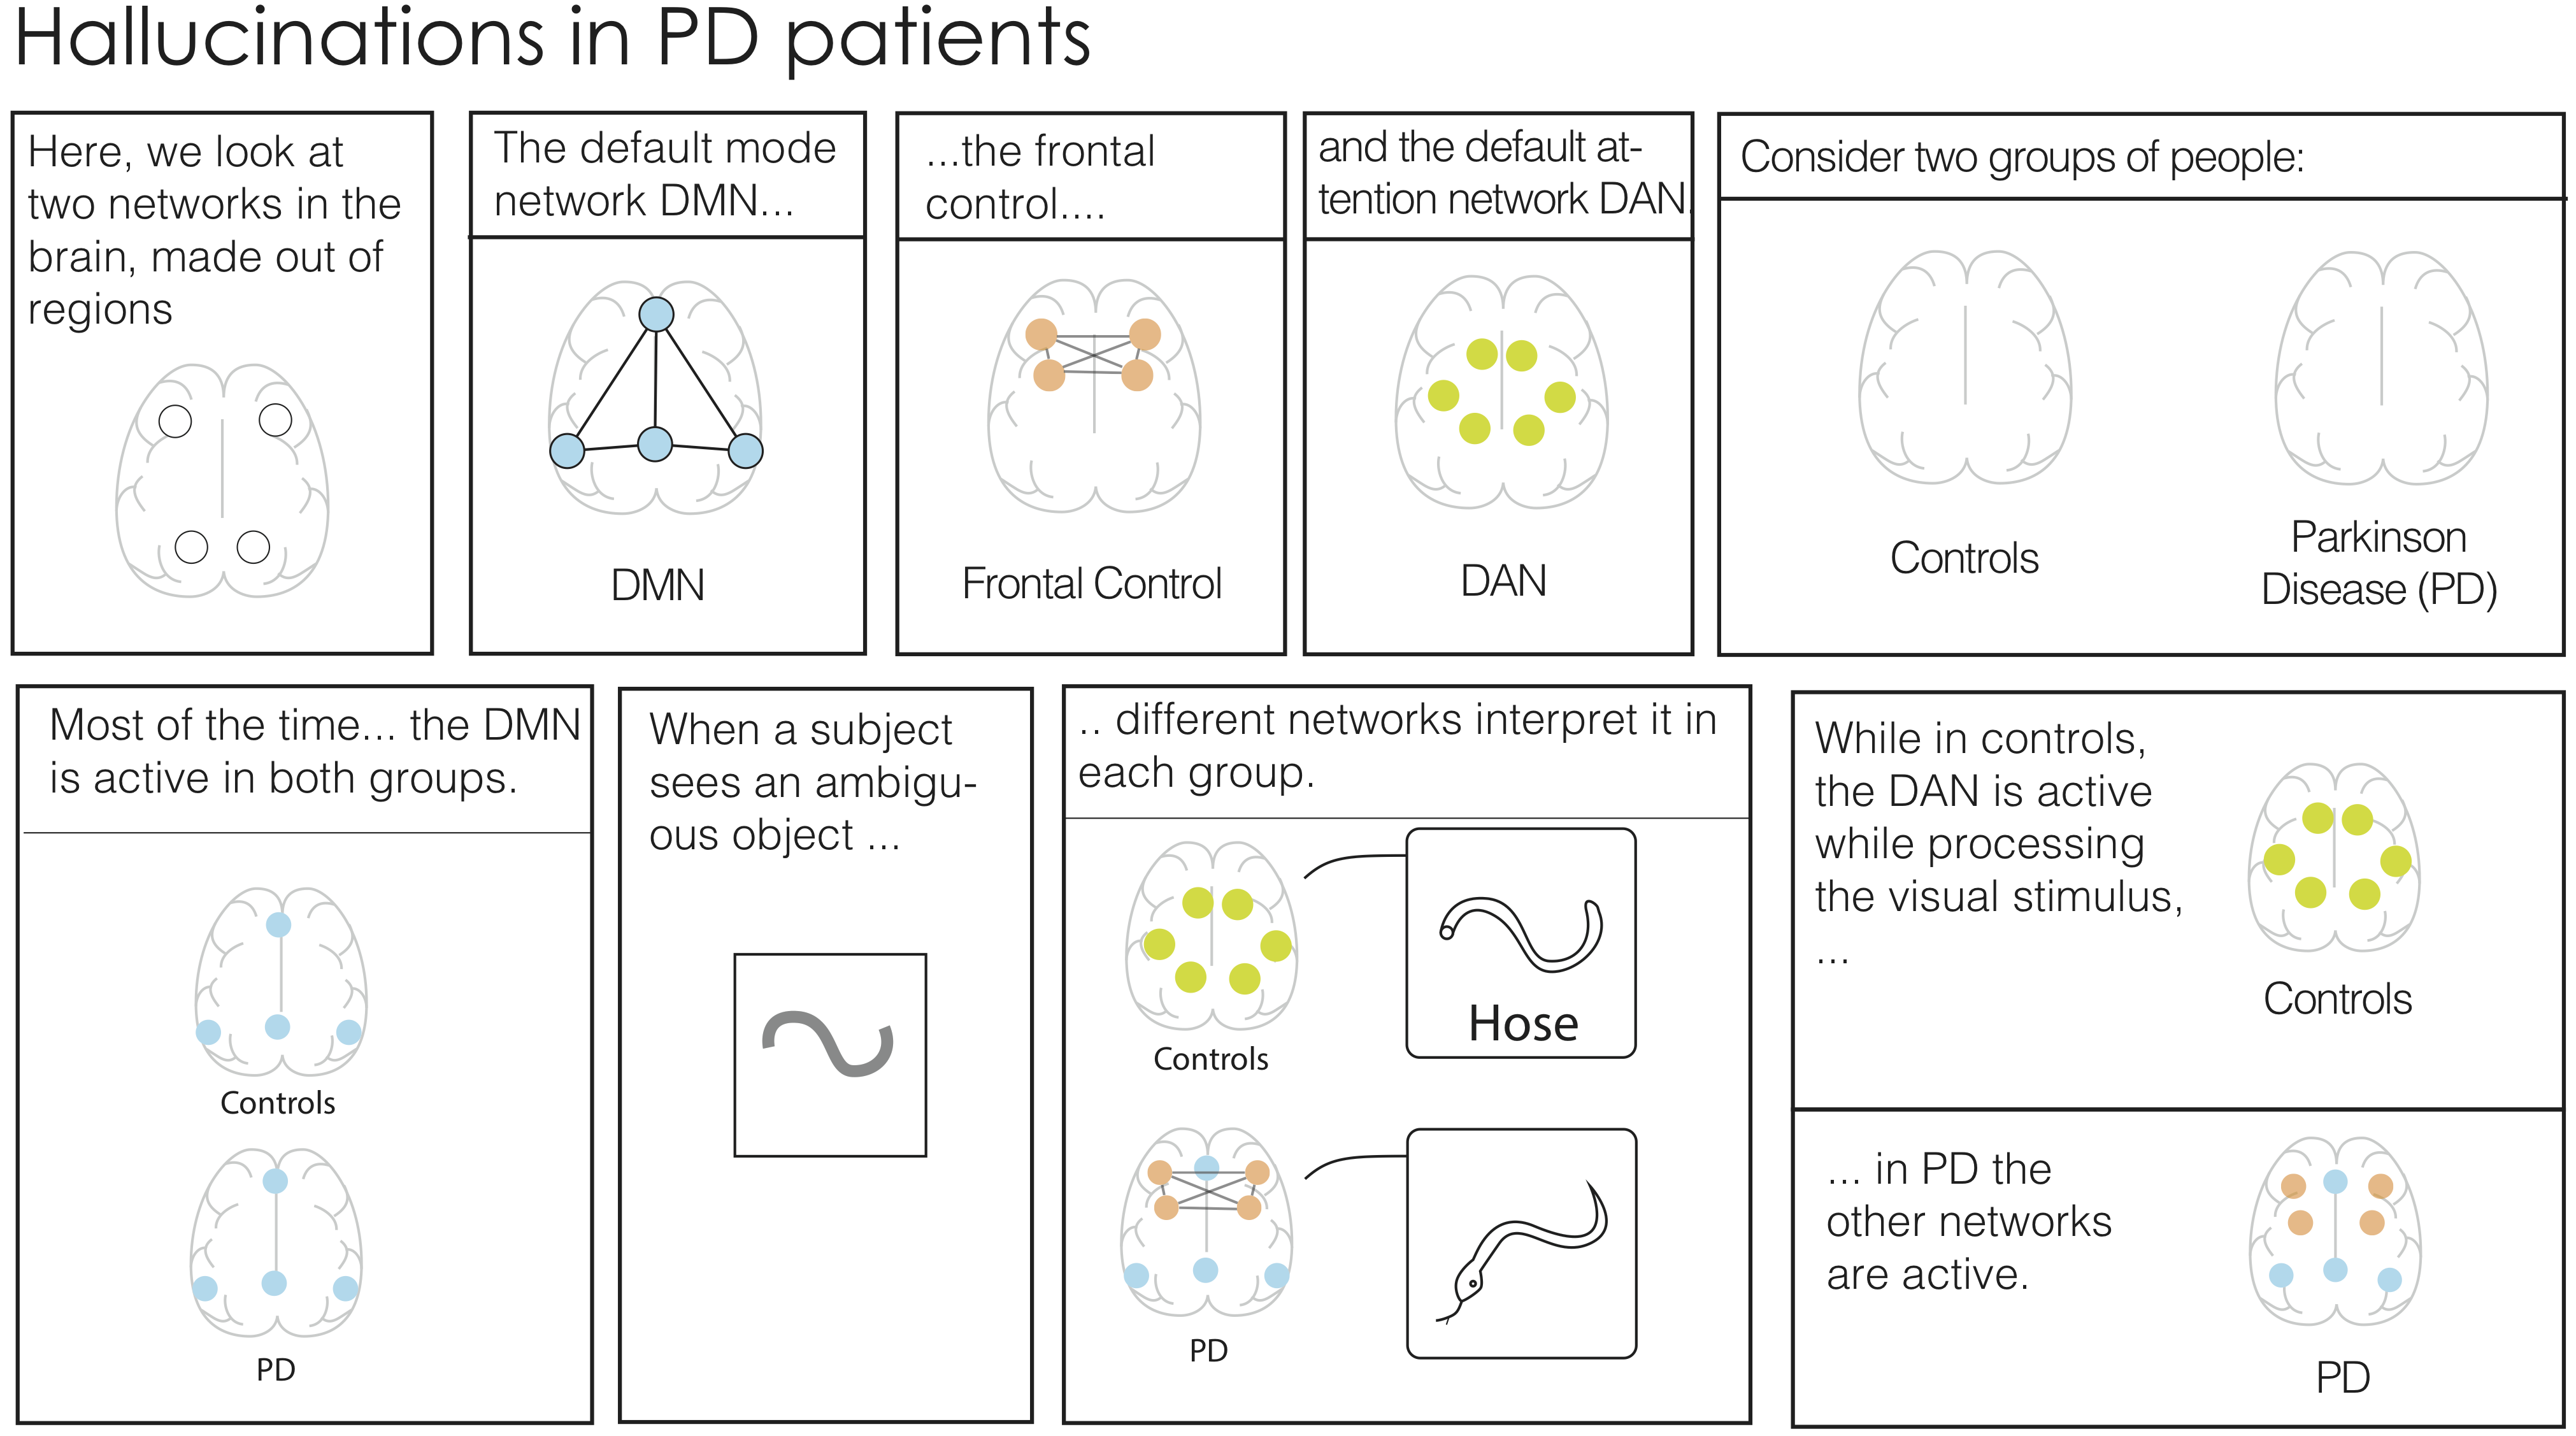
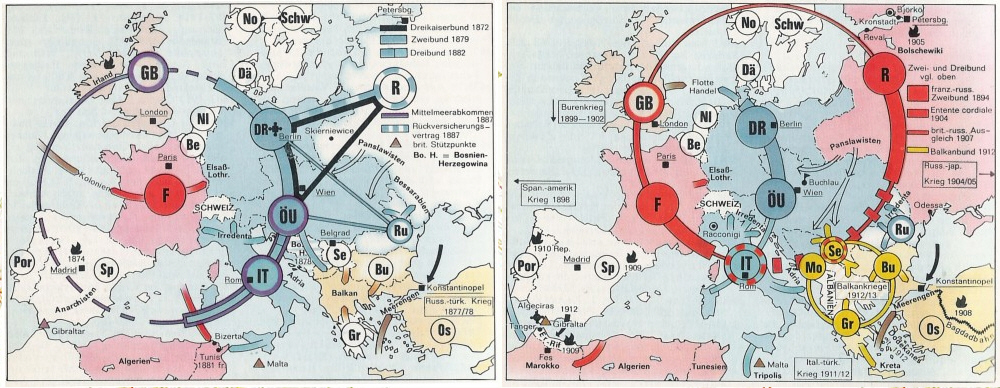
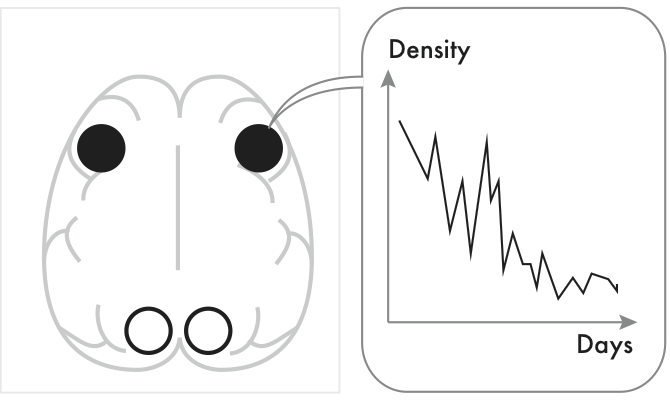
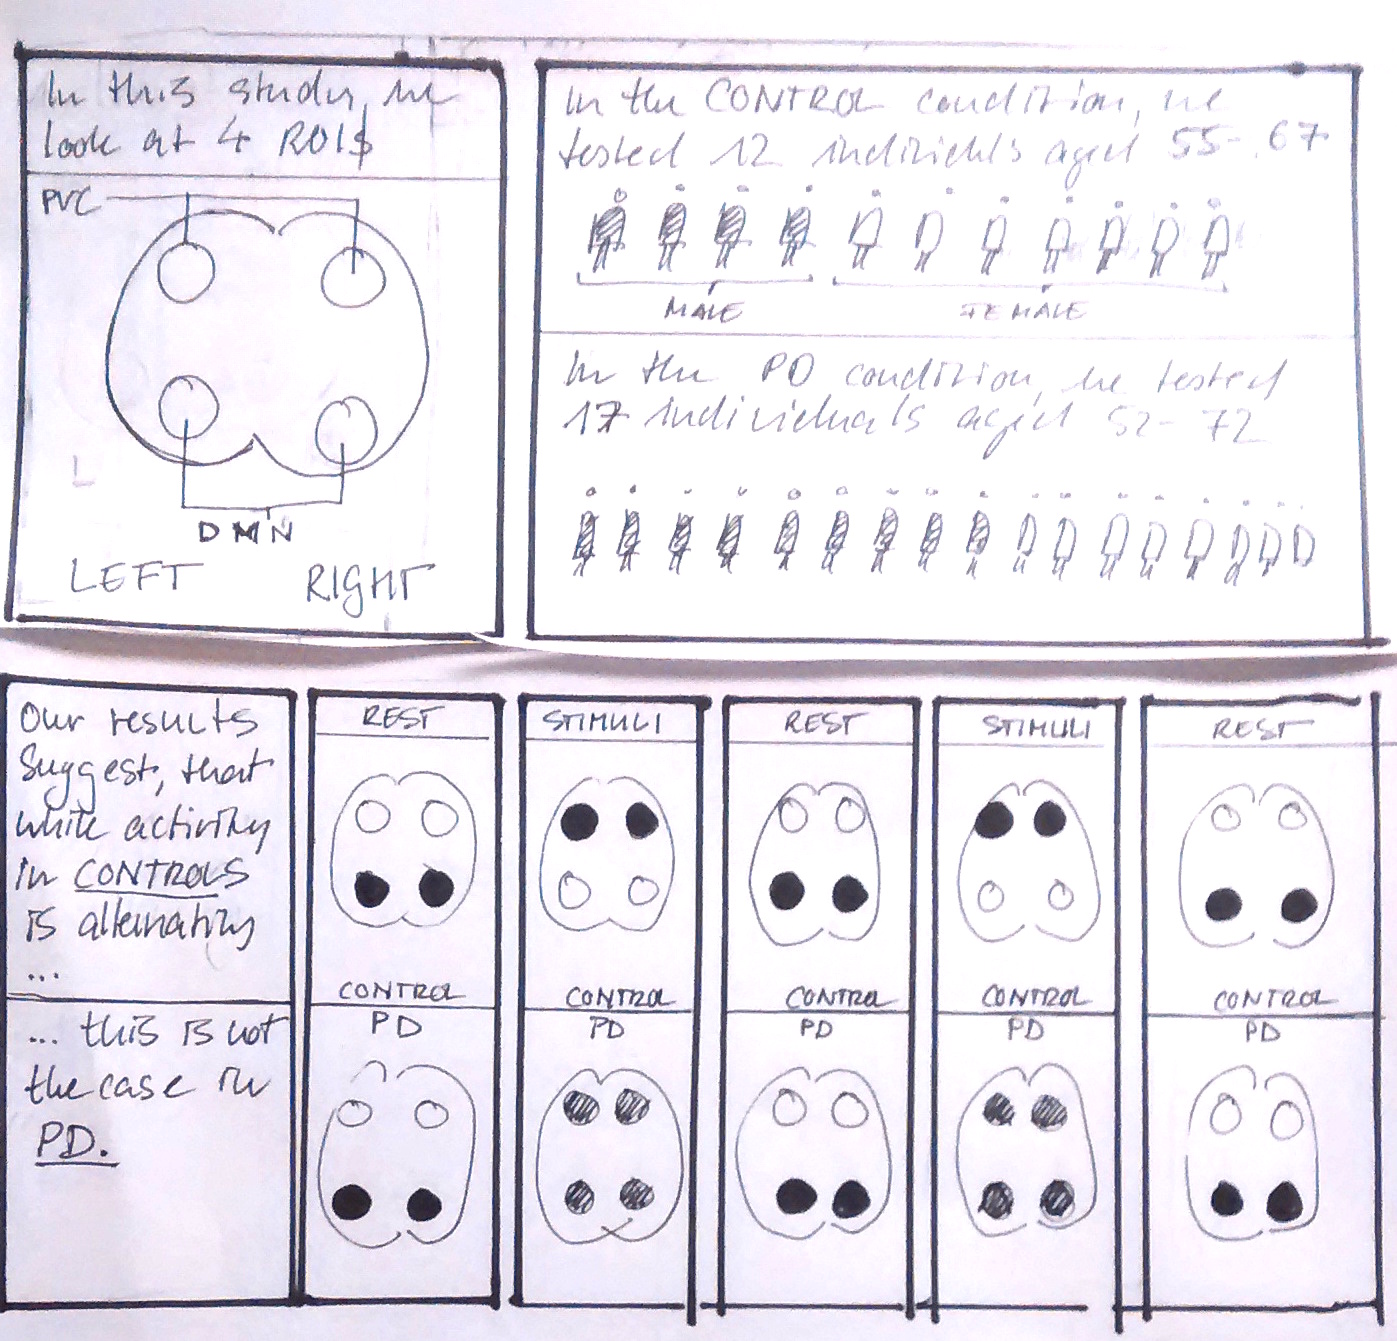
5. Discussion with Domain Experts: We contacted two domain experts that we thought were interested in discussing the potential of graph comics in their respective domain: a neuroscientist and teacher in history. With the neuroscientist we spend several hours, spread over one week, in close collaboration to discuss cases where graph comics would help in a) illustrating changes to students in a text book, ii) sketching a hypothesis in a grant proposal, and iii) illustrating findings from a study. The resulting comics and sketches have been considered in our framework, as resulted from step 4. With the teacher we had two 1h long sessions, discussing the comic illustrating the alliances before World War I.
.png)
.png)
.png)
.png)
.png)
6. Reading Study: For the reading study, three comics have been selected and their stories being refined to cover as much cases from our considerations and design solutions, as possible. Those comics have been digitalized in Abobe illustrator. During the study, we adapted the comics where participants found our designs confusing (e.g. dashed lines to show object removal).
.png)
.png)
Reading Study
To investigate if a general audience could read and interpret graph comics, we conducted a qualitative user study where we asked 10 participants from diverse backgrounds to interpret the comics. Our hypothesis were the following:
H1: graph comics can be understood without training,
H2: ambiguities can be resolved via discussion.
Findings from study (see below) were integrated into our set of designs for our factors-to-consider (pre-review "Design Considerations"). The designs on this website and in the paper are the final ones.
Methodology: We followed an iterative methodology akin to rapid iterative testing (RITE) to investigate the readability of Graph Comics. We prepared three initial comics including visuals and annotations. After each session, we iterated on the visual designs that proved ambiguous to participants, and steadily decreased the amount of annotations to assess how interpretable the visuals were without text.
Participants: Participants were recruited by an independent service and told they would get their gratuity independently of their performance. Five equally long sessions were held, each with two participants. Experimenters were not present in the room as this could have made participants feeling uncomfortable or imply that we could be part of the discussion. Rather than deciding a priori on a number of participants, our criteria was to gather enough evidence that comics could be understood by non-experts (the case after 10 participants).
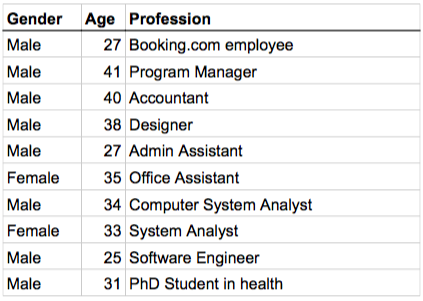
None of our participants was knowledgable in graph analysis or visualization. The age average was 34.1 years. 2 participants were female. Details about each participant can be found below.
Setup: To ensure participants would vocalize their interpretations, we ran sessions in pairs. In the introduction, social networks were explained, but participants were not instructed on comic components or visual encoding in any way. Participants each received a copy of the same comic and were encouraged to first read and annotate them before discussing among them- selves to reach a consensus. During discussion, they should agree on one story for the respective comic. The experimenter left the room during the discussions as to not imply that he is part of the discussion. Video and audio was recorded at all times (see below).
Participants have been introduced to the topic with only a simple sheet that defines our terminology with respect to networks: nodes, links, and groups (which contain nodes).
Comics were discussed always in the same order: Start-up, Familiy, Criminals. Discussion for each comic was split into two parts. The first part involved only the two participants discussing the comics. In the second part, the instructor asked one of the participants to tell the story that was agreed upon. Participants reported their interpretations and the experimenter asked for clarification if necessary. The videos of all sessions are found below.
Videos - Discussion phase
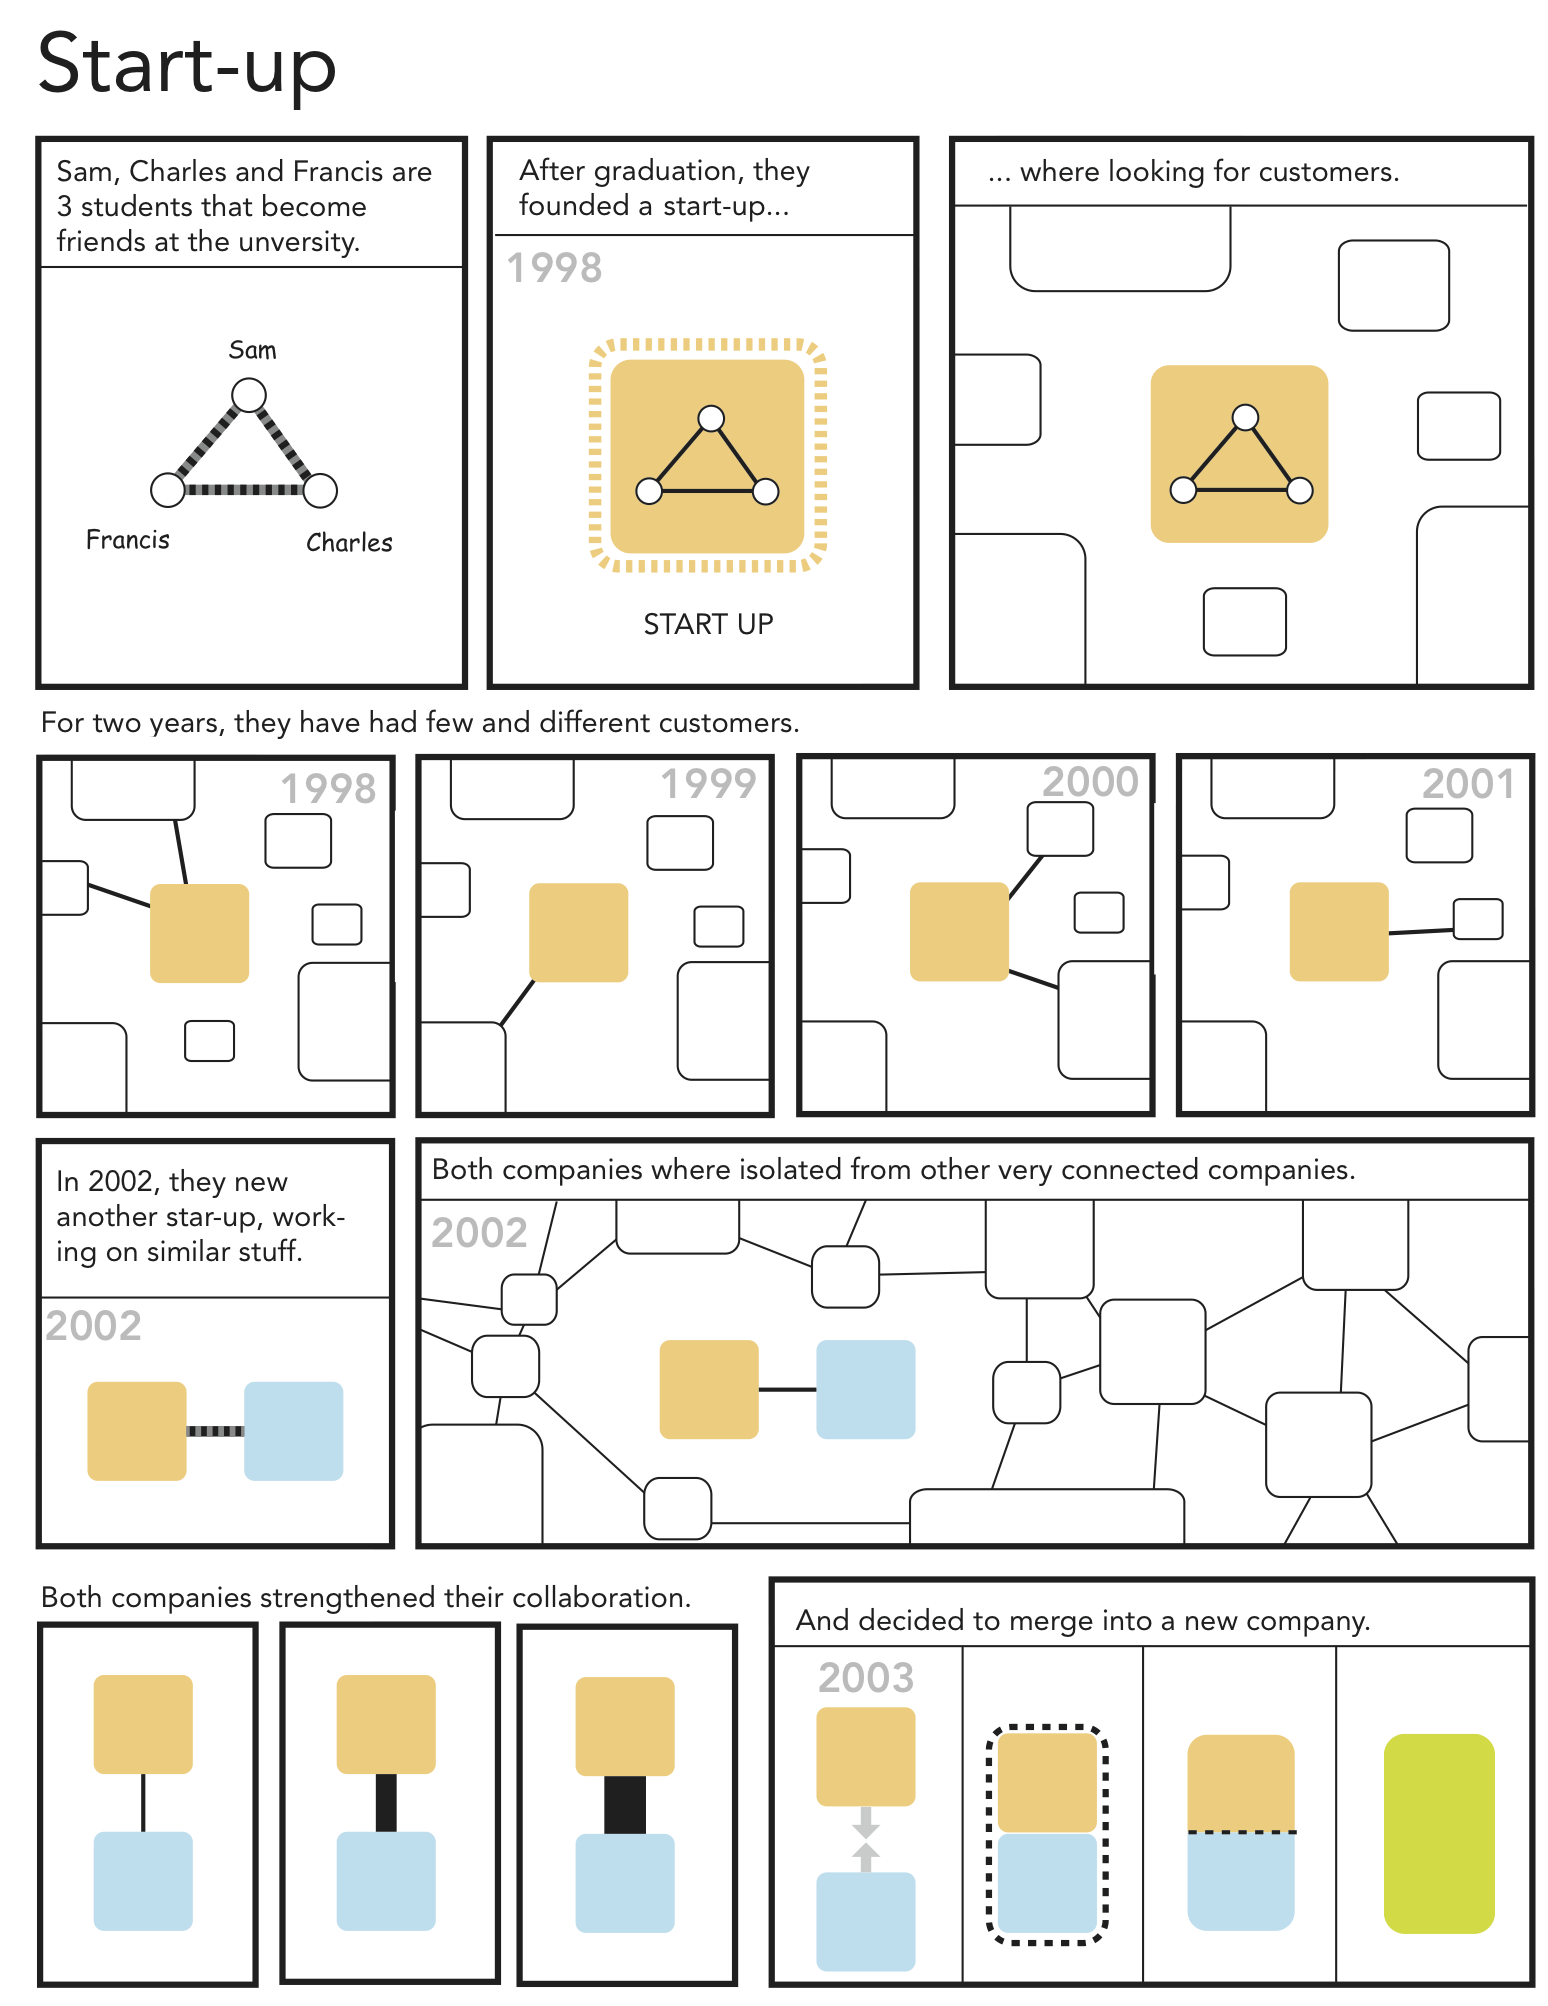
Videos are being compressed, will be made available in the following days.Comic 1: Start-up
Pair1 (Anonymized)
Pair-2
Pair-3
Pair-4
Pair-5
Comic 2: Family Network
Pair-1
Pair-2
Pair-3
Pair-4
Pair-5
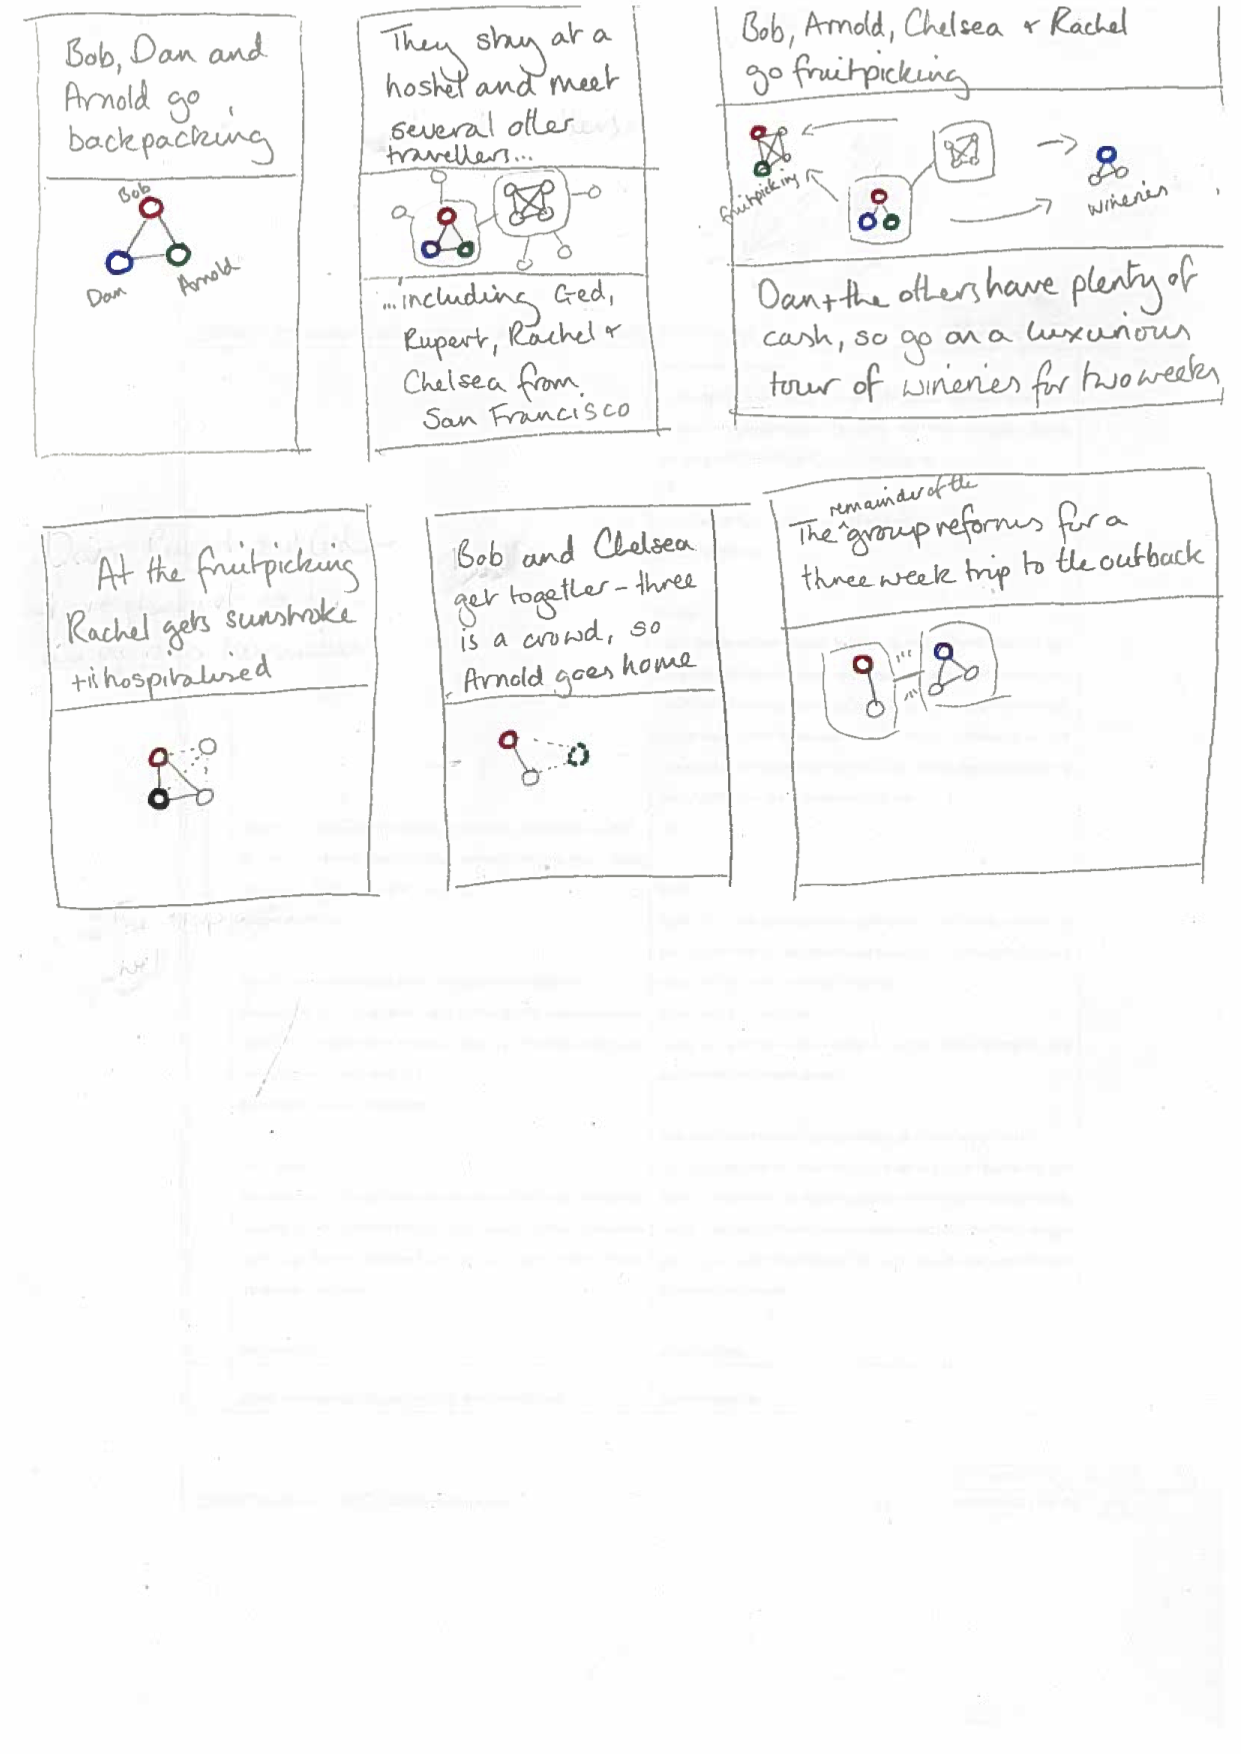
Comic 3: Criminal Network
Pair-1
Pair-2
Pair-3
Pair-3
Pair-5
Exerpts of Discussion (Video Transcripts)
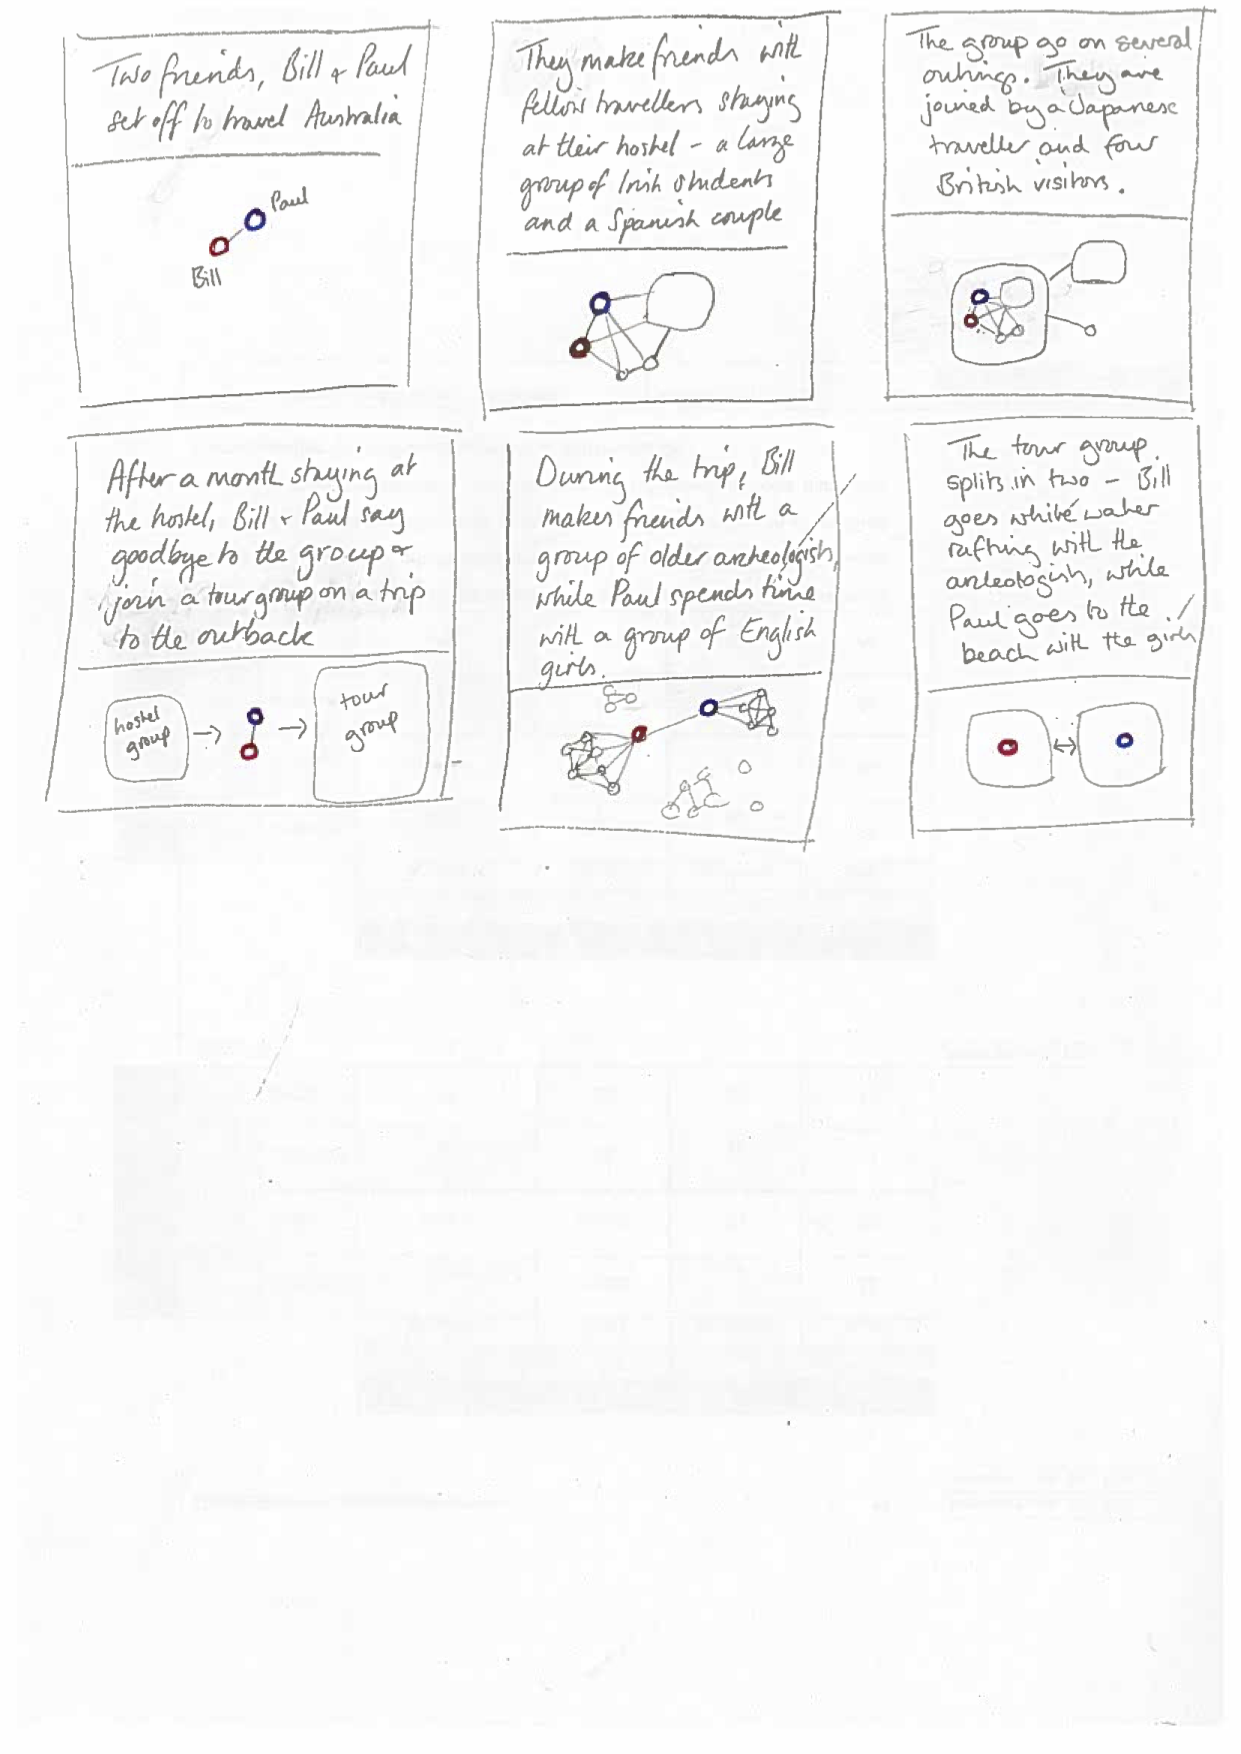
Comic 1: Start-up
Then here it seems that they actually formed a partnership with someone, and this tells me, you know, in time how actually strong that partnership was. Around this time, this tells me that both of these merged. This tells me that they were actually winding down, and this tells me they actually dissolved. So what this tells me is that there was a finite amount of time for this partnership that they had, and so they basically merged and then they dissolved. So that's my story.
Comic 2: Family Network
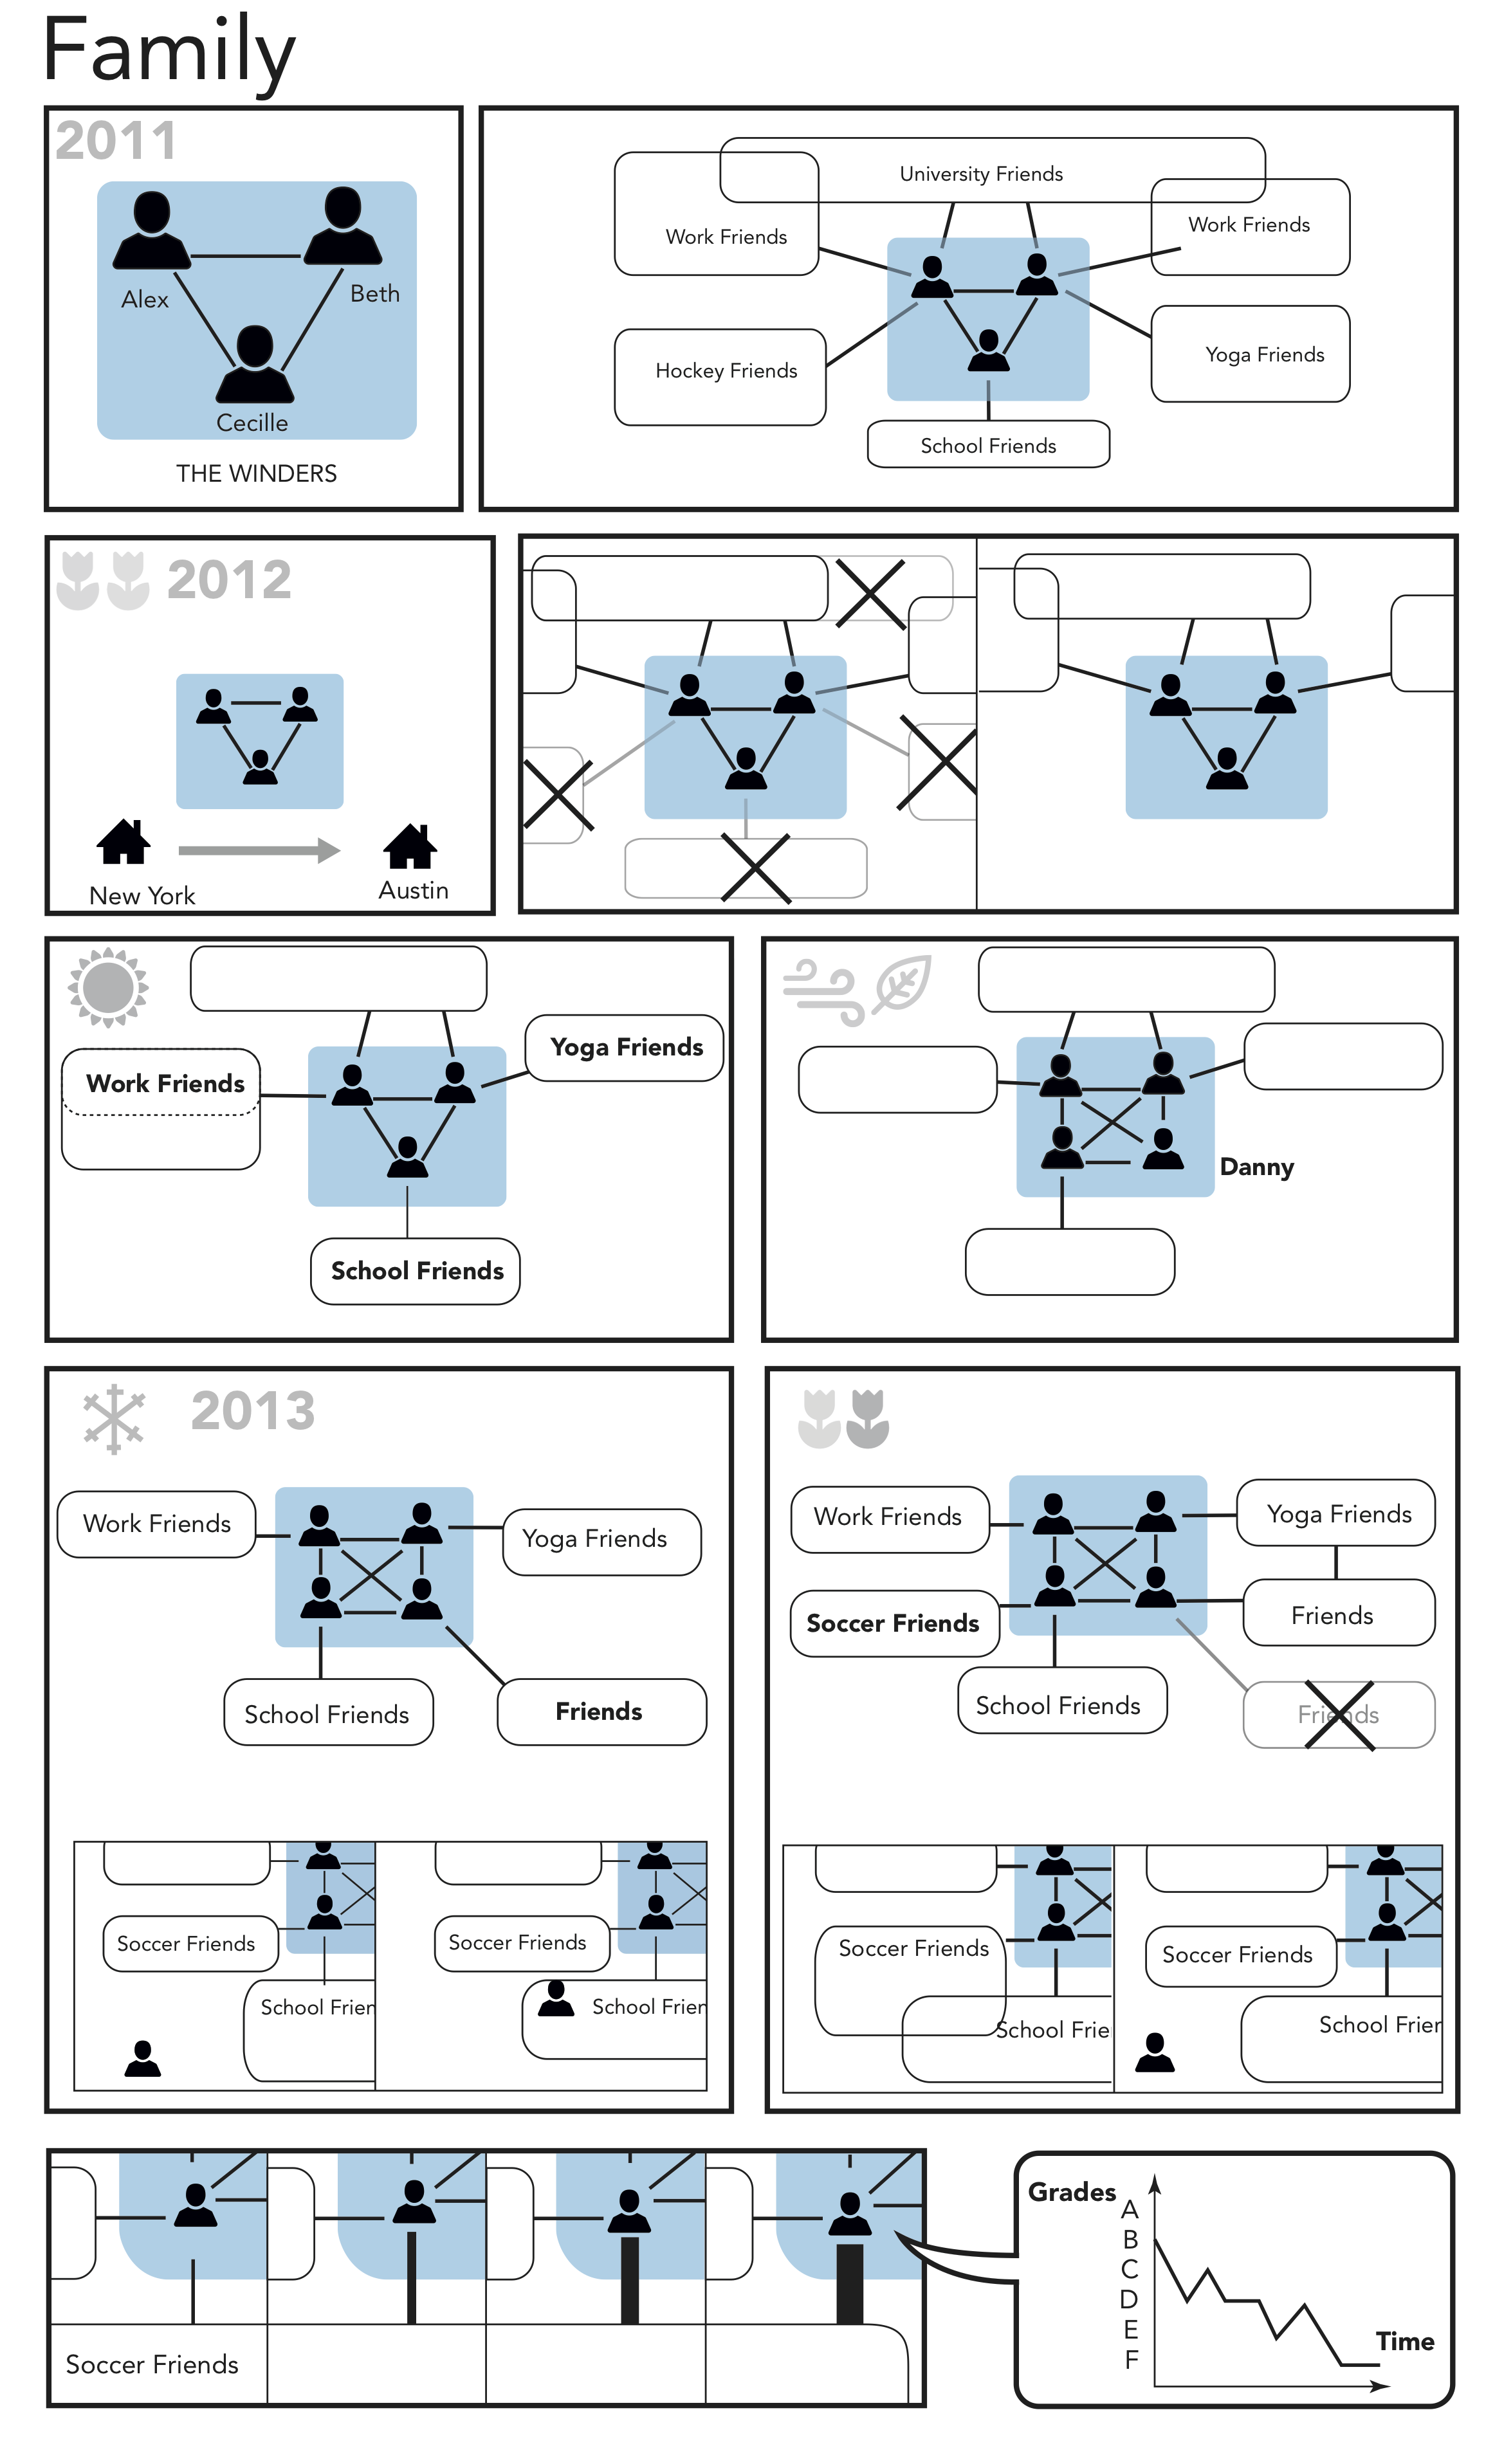
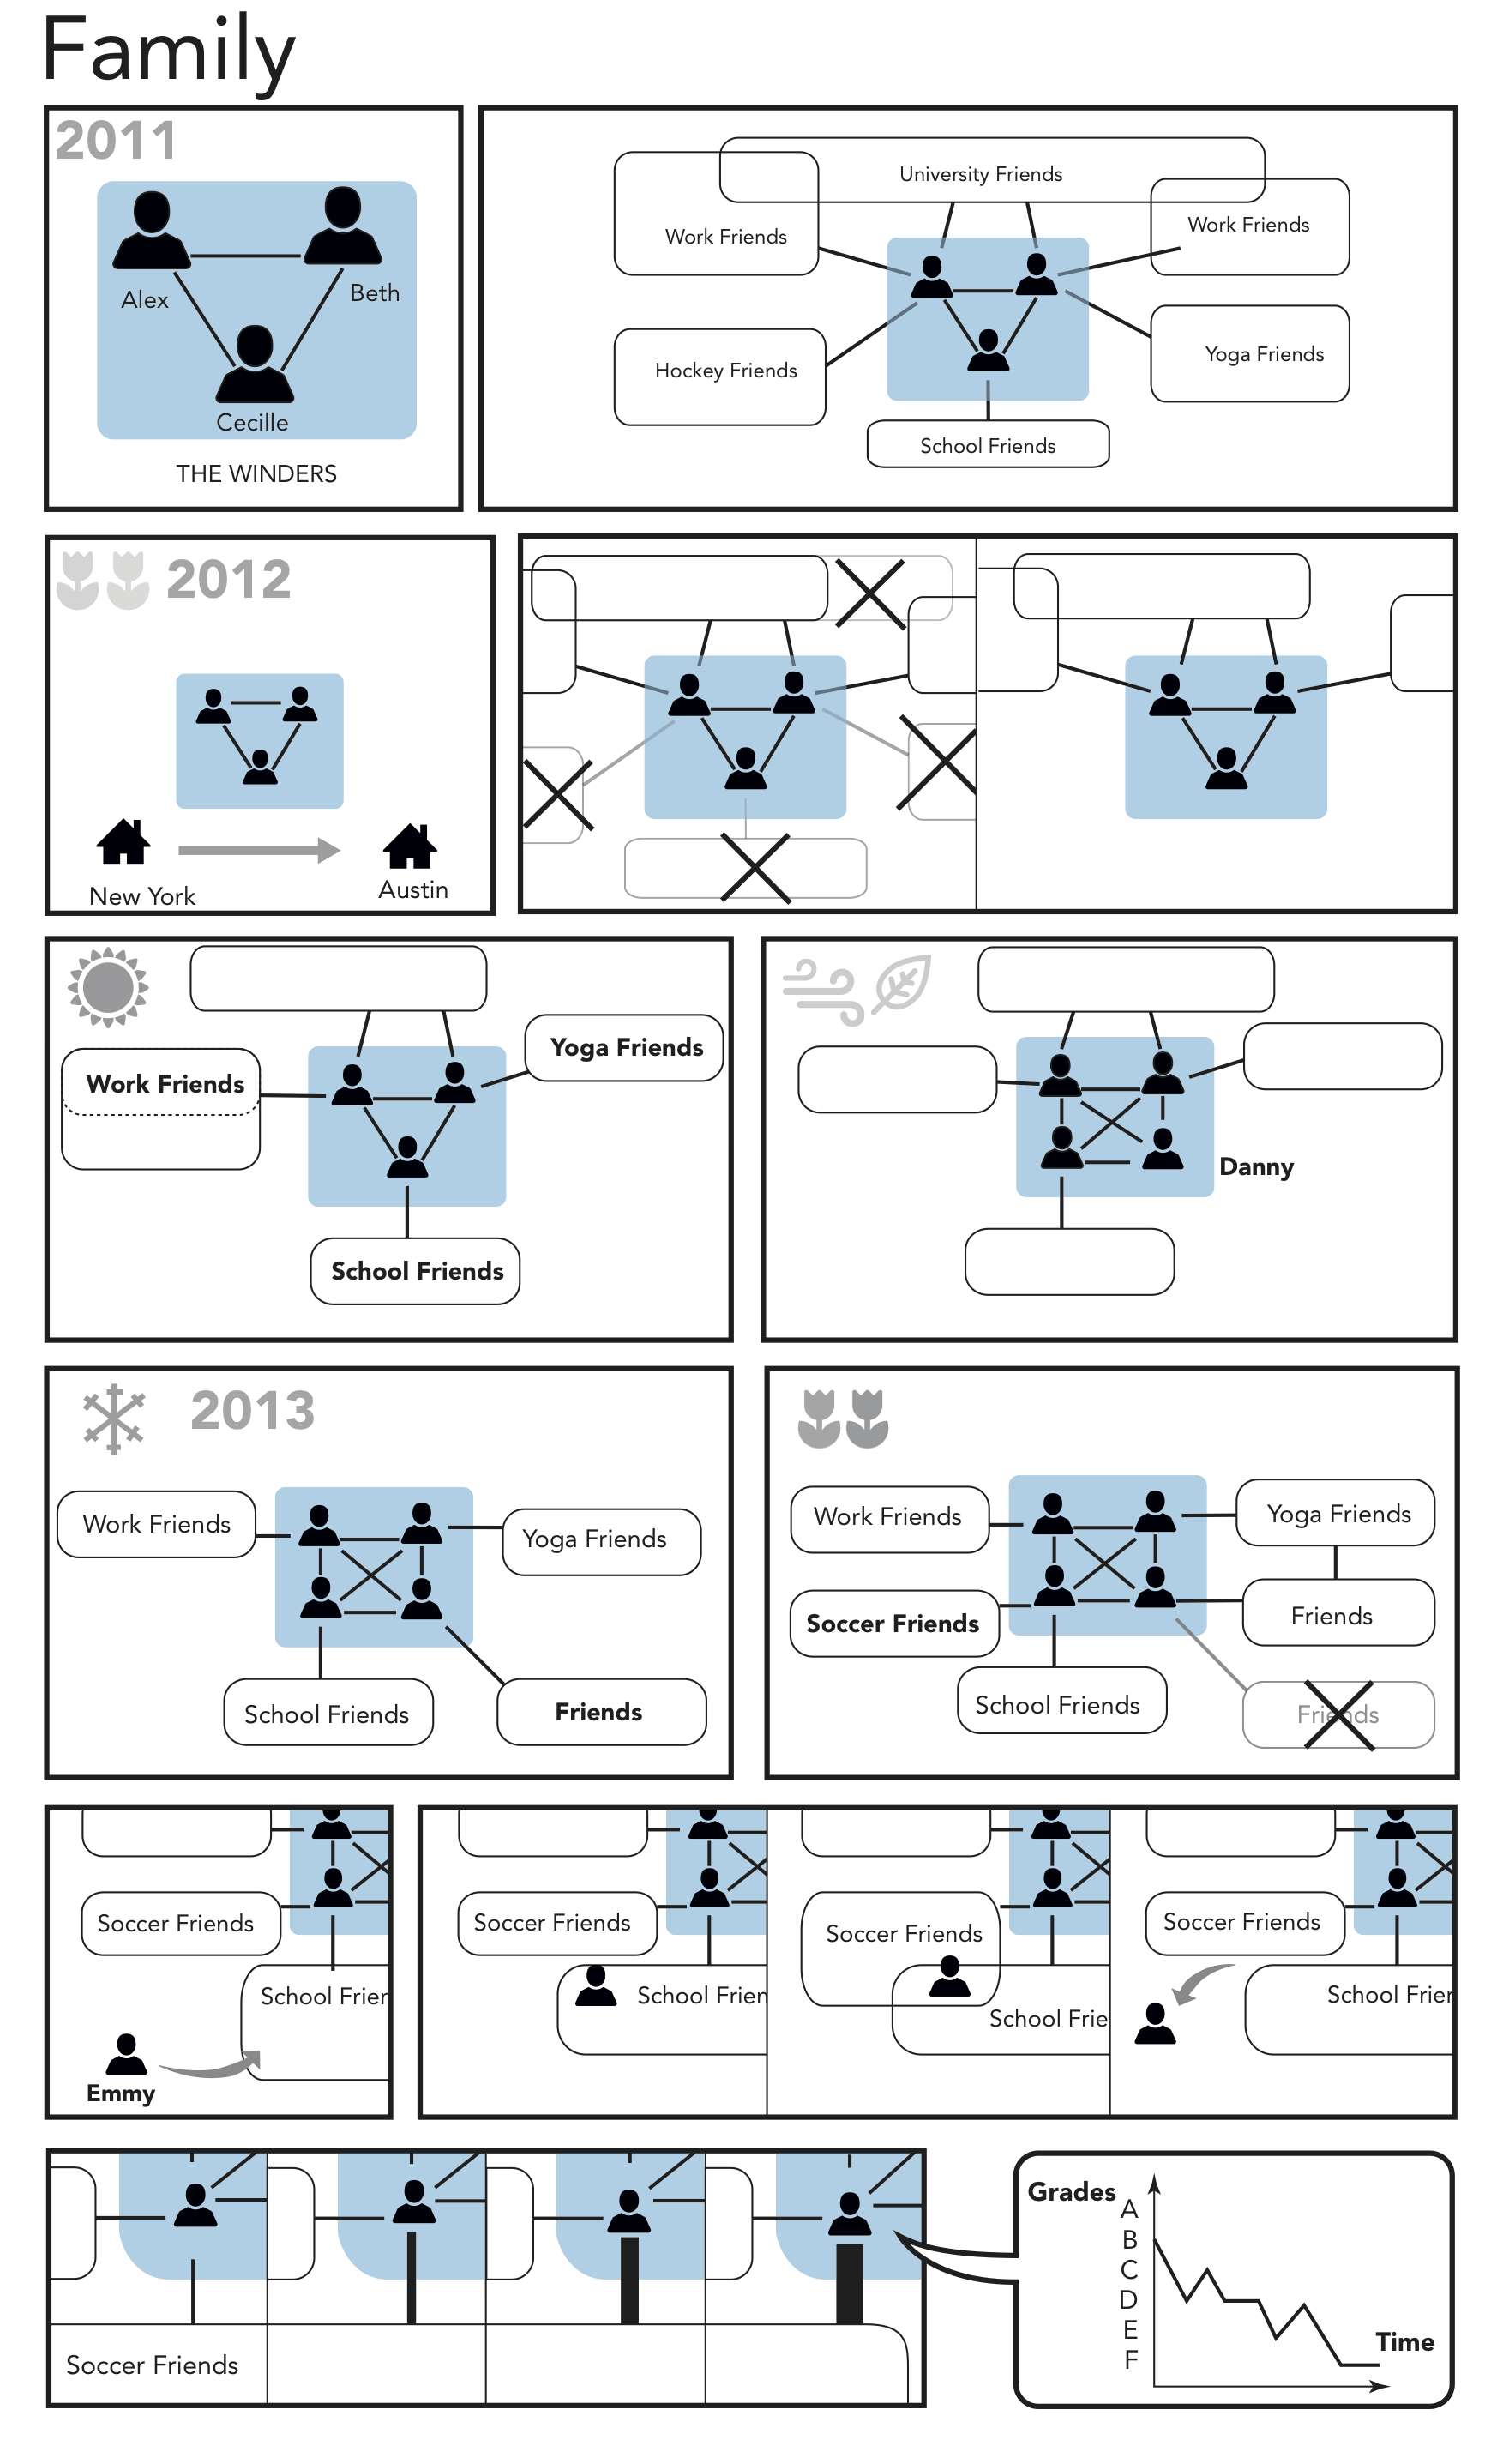
So I think we have a family of three here, Alex being the dad, Beth the mom, and they have a child, Cecil. They represent – their friends are their networks through these boxes. So Alex and Beth, they have university friends, and after they probably find jobs, they have work friends as well. And they have overlaps here, which indicates that both university friends and work friends are common. They also have hockey friends outside of their work and school. Hockey friends, yoga friends between Alex and Beth. And of course, their child, Cecil has a school friend. Looks like spring 2012 that Alex get a new job, they move from New York to Austin.
Comic 3: Criminal Network
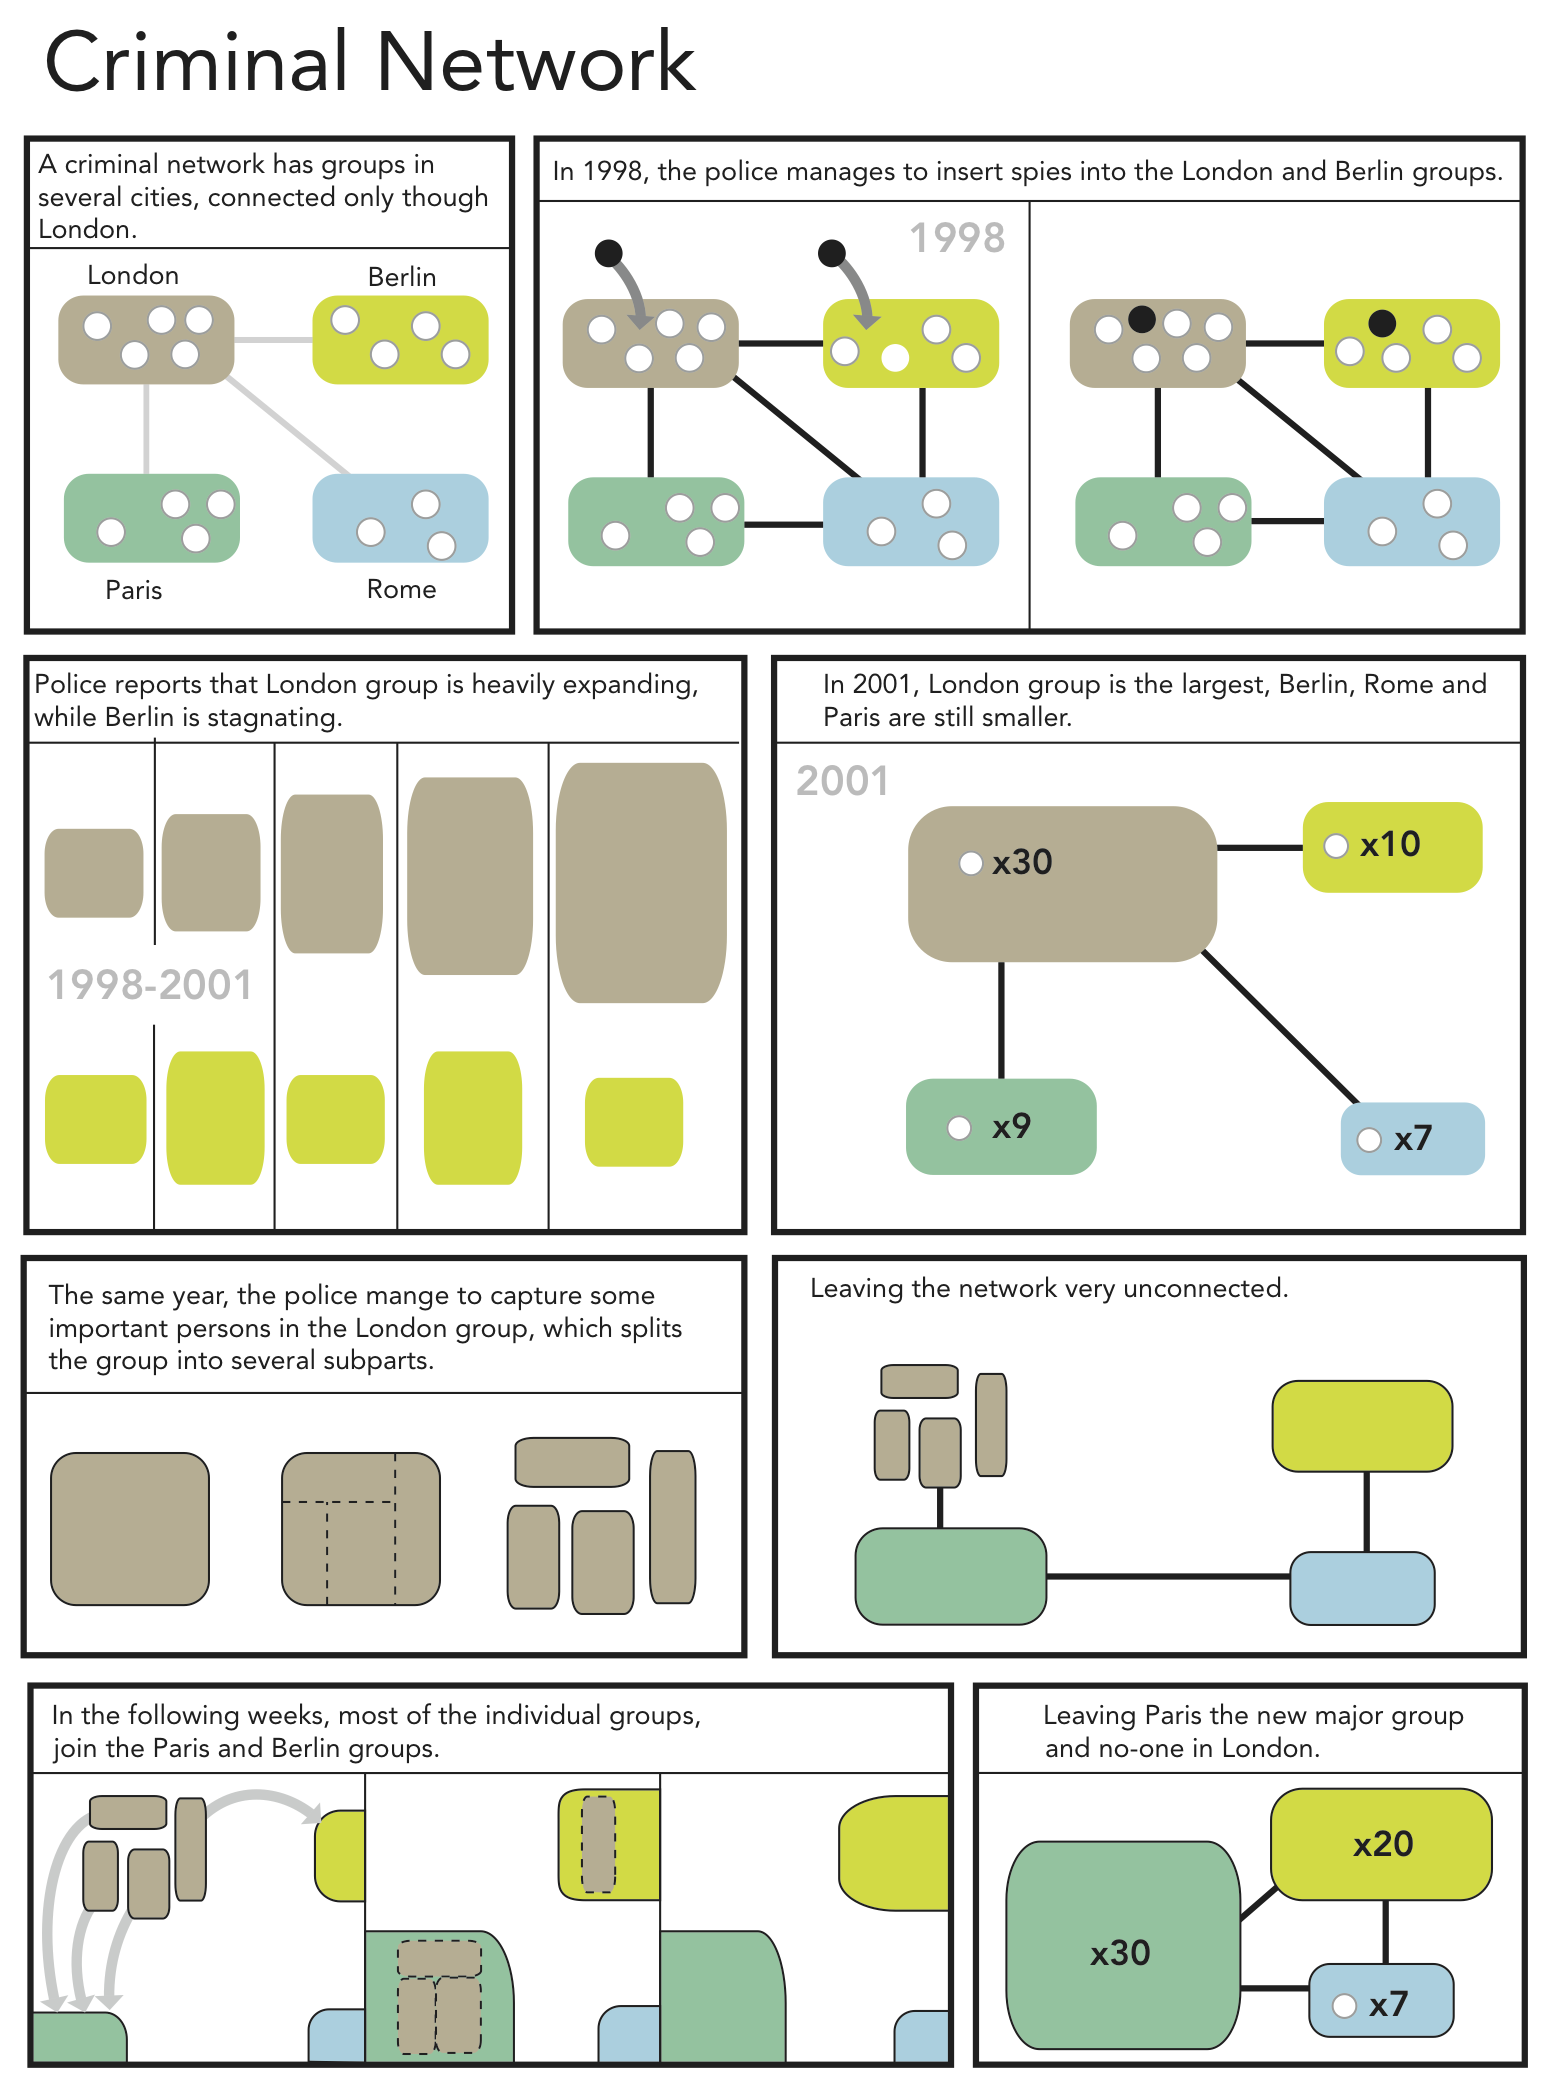
We see here a progression, an entity entering this beige group, entity leaving the yellow group and joining these – gets bigger, leaving, gets smaller.
From 1998, there's – the beige group seems to get bigger, however, the yellow group's getting – it went from small, went big again, and then somebody left, went smaller. So that's in 2001. 2002 there's an external entity here. Looks like it's going into this group, maybe a problem, a person. This represents a new face, maybe the leader or something. And it breaks this nucleus, and the members separate – they go in separate ways as they progress here.
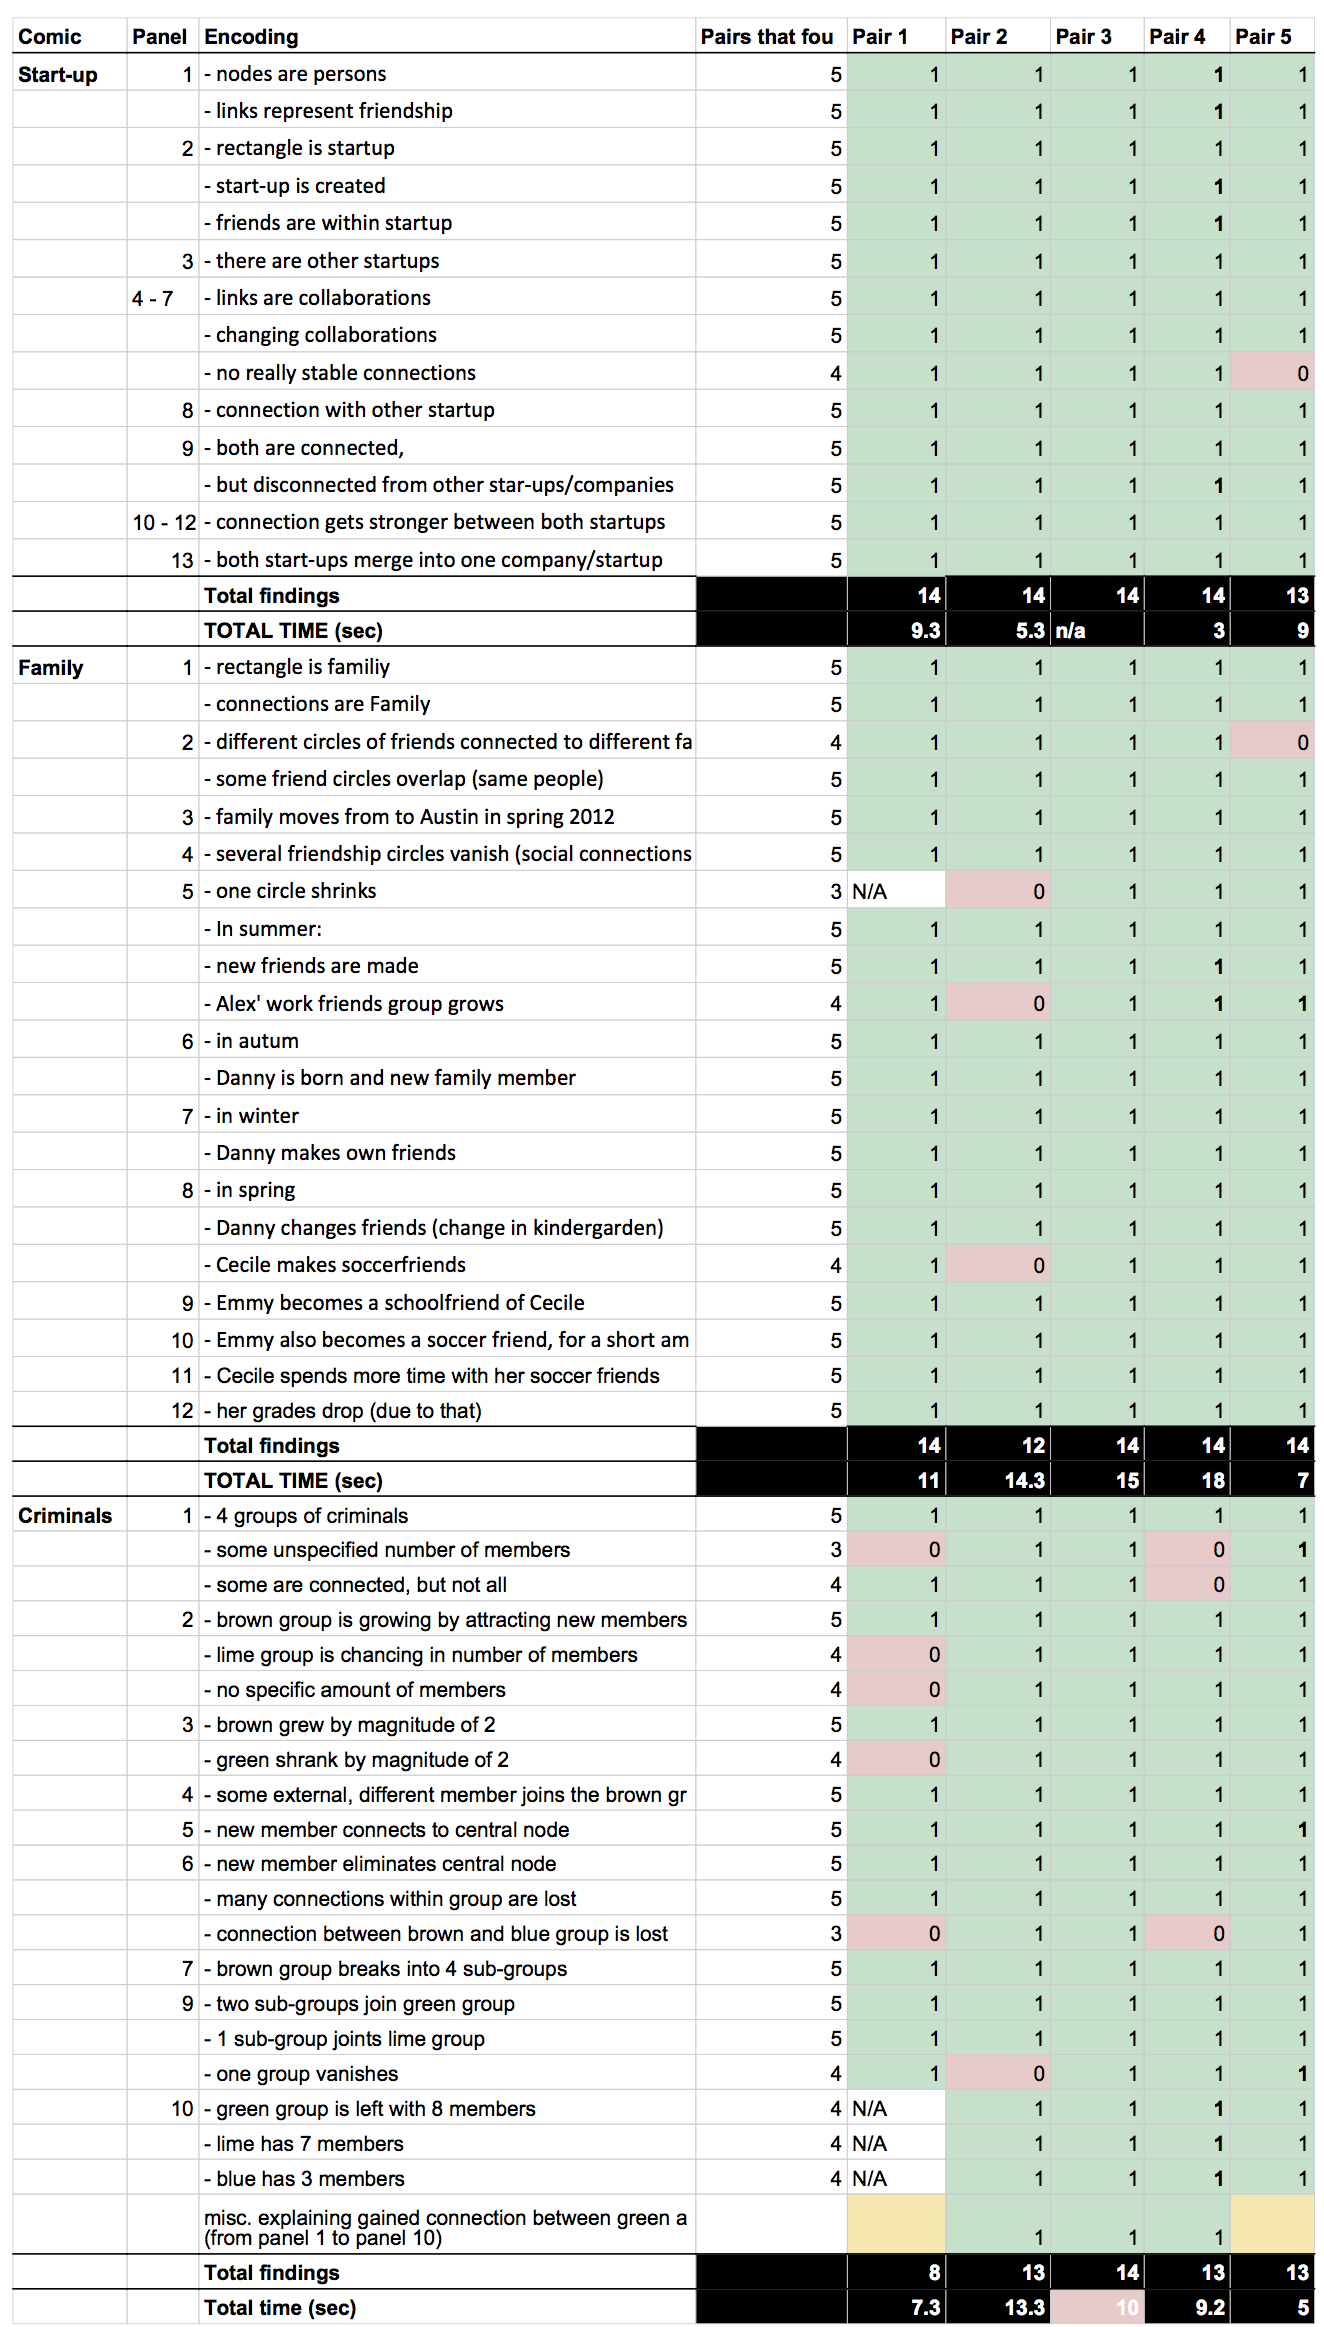
Results: Based on those records,we coded the videos according to a) which findings participants found and b) how long it took the to find the finding. The table below shows the detailed results for findings in each panel and each of the 3 comics used within the study.
The first comic was entirely discussed in 3.1 minutes. Note, that discussion involved the time it took participants to read through the comic, understand the changes, formulate those changes in the context of the story, and respond to eventual questions. The second and third comic was entirely discussed within 14.1 and 8.1 minutes, respectively.
Findings:
(comming soon, see paper for now.)
Limitations: Results from our study show that participants were able to understand the story conveyed with our graph comics either directly or clarified the meaning in discussion. We confirmed our hypothesis and are positive that graph comics provide a valid medium to communicate changes in dynamic networks to non-expert users.
Changes to the comics, made during the study, aimed to assess the value of alternative designs for cases that have found to cause confusion, e.g. dashed lines. Our results do not show that those designs, e.g. crossing-out elements to indiciate removal, are the best designs to convey the tested changes.
Another limitation is the number of participants. Again, the goal was to refine and iterate over initial designs for our factors to consider when creating graph comics. We stoped at 10 participants since no new isses were found that may have caused adaptions to our framework. More participants can help better quantifying which encodings are easy to understand (take less discussion) and in which order participants decode comics, e.g. quick overview, of panel-wise.
Future studies can approach graph comics from a more systematic view, investigating alternative designs and investigate which types of graph changes cause more problems to understand.