On the occasion of the 25th birthday of the
VIS conference
and its unprecedented location in France, Charles Perin, Pierre Dragicevic, and Jean-Daniel Fekete
organized an exhibit on Jacques Bertin.
The exhibit focused on Jacques Bertin’s work that is less known by the community, including his
reorderable physical matrices. In addition to exhibiting some of the original material, we fabricated
a large-scale wooden replicate for attendees to try themselves.
This work was also published in the CHI'15 workshop "Investigating the Challenges of Making Data Physical". The publication is available for download here.
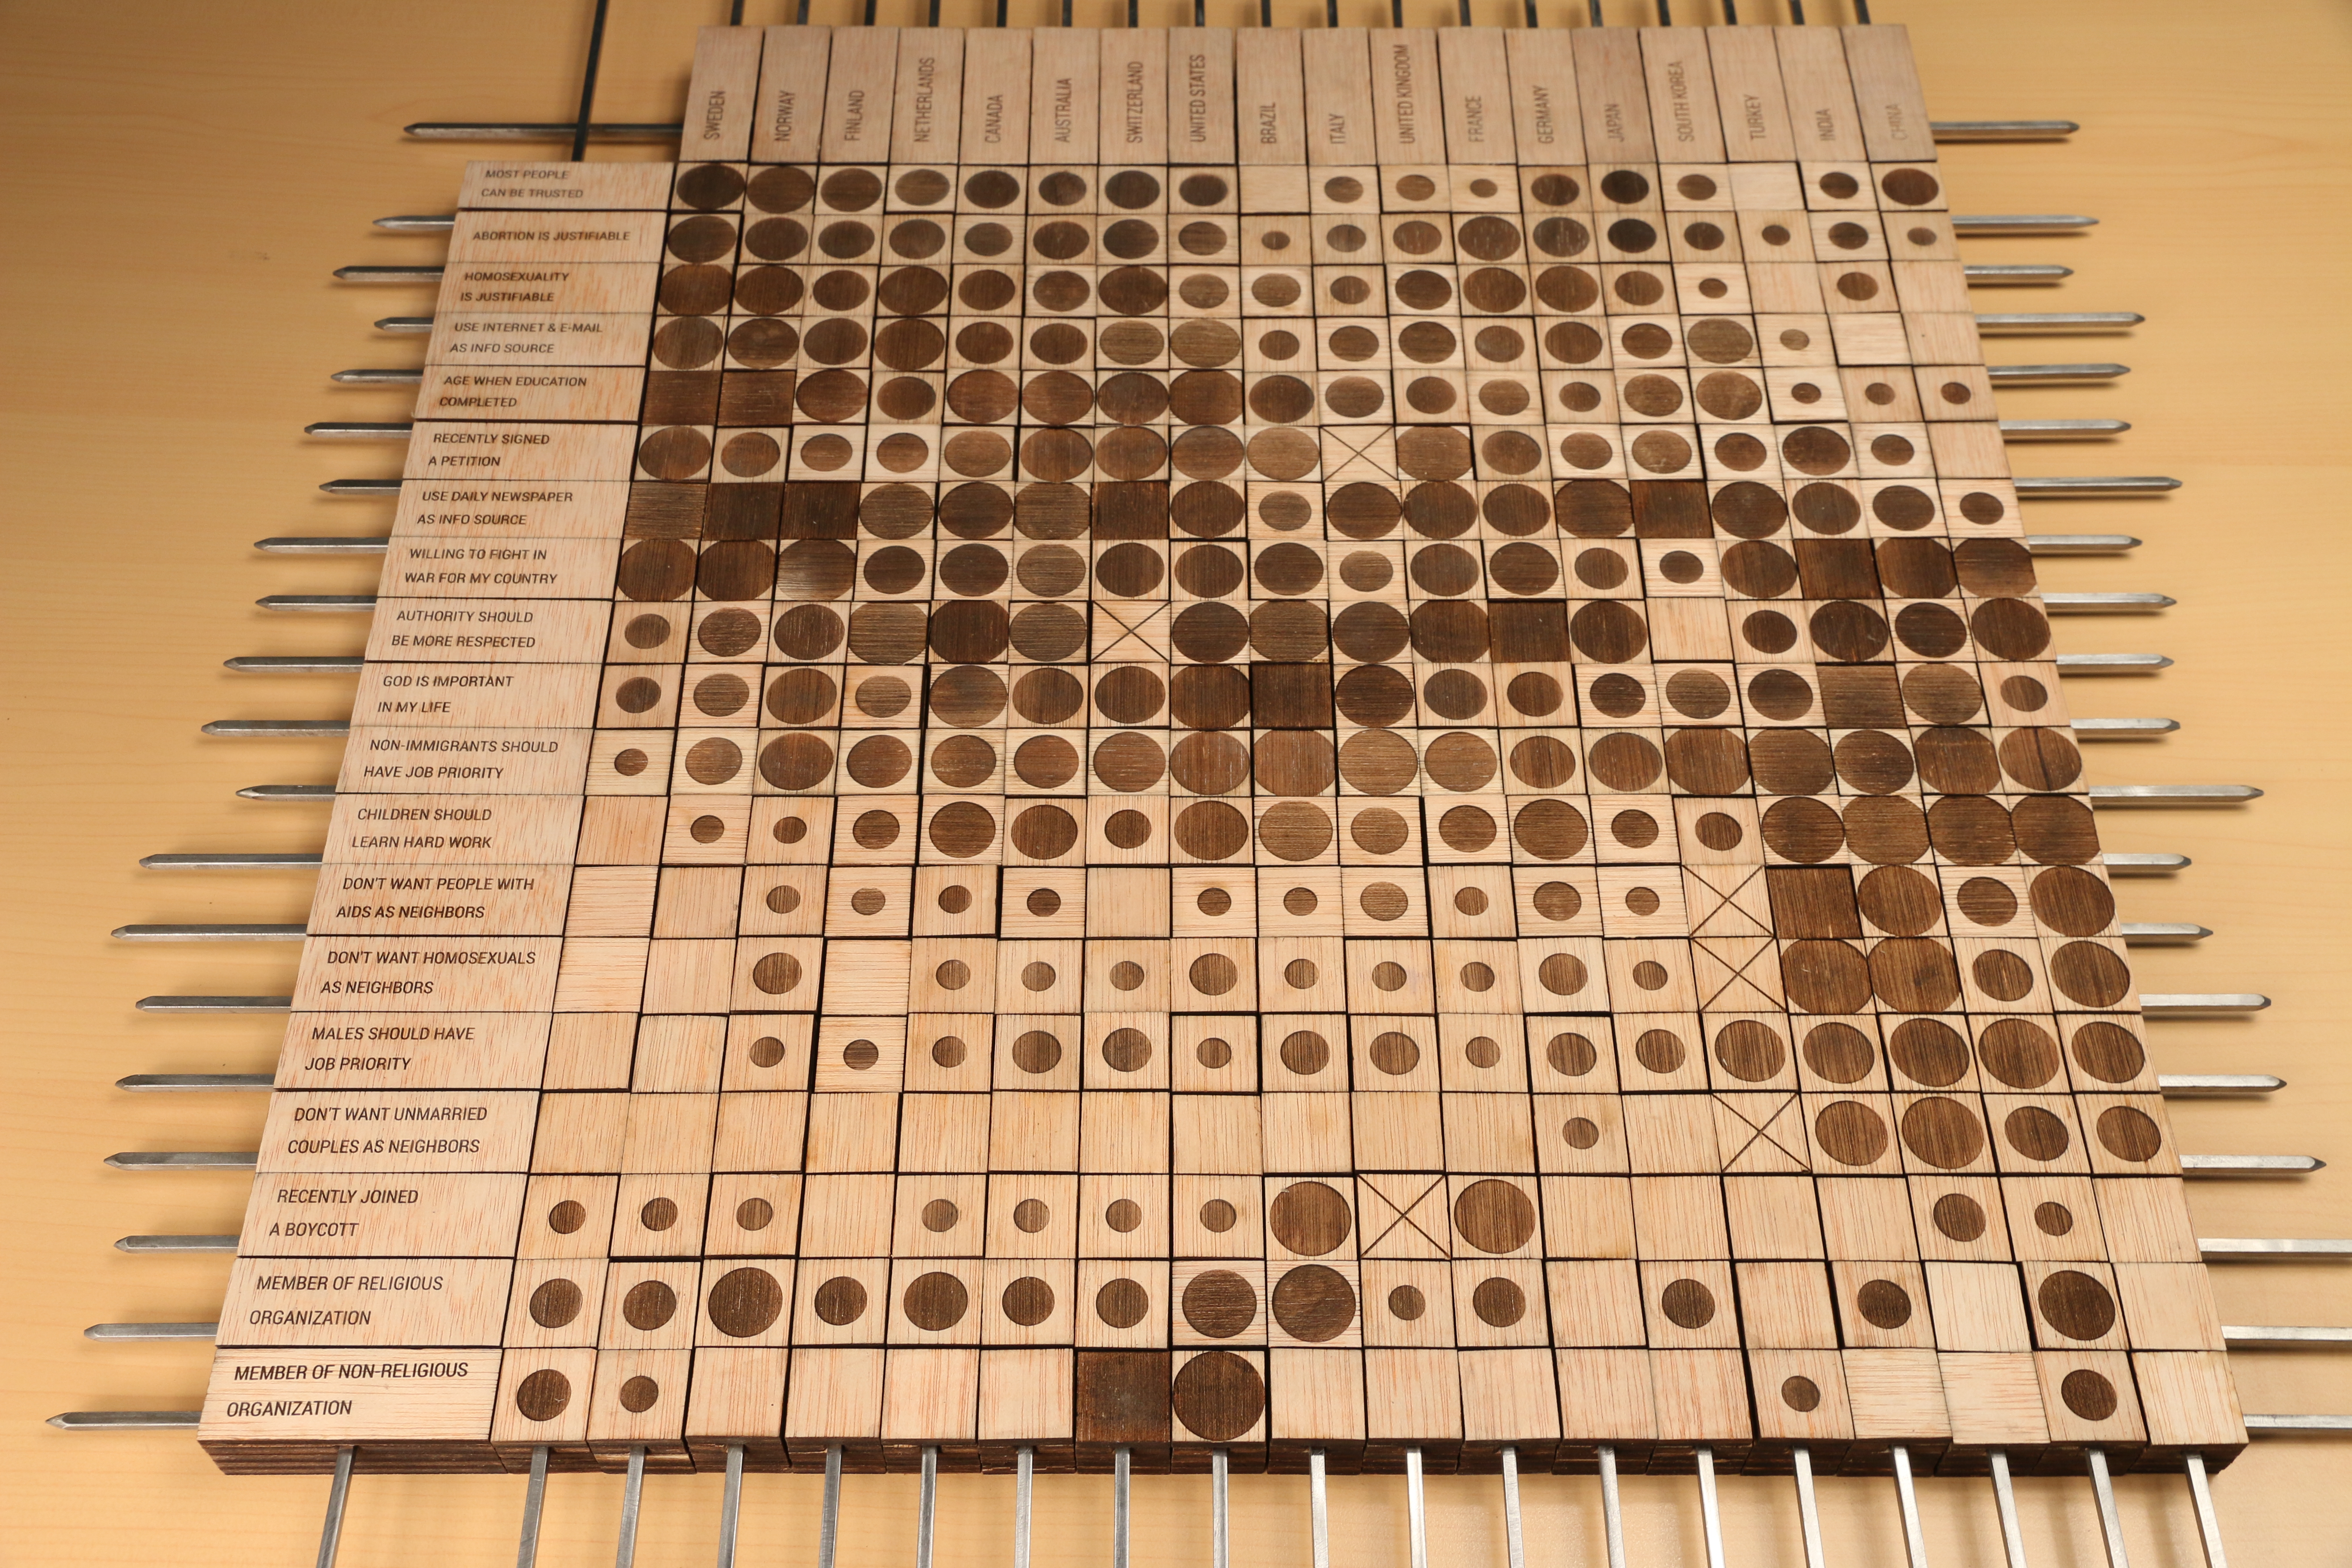
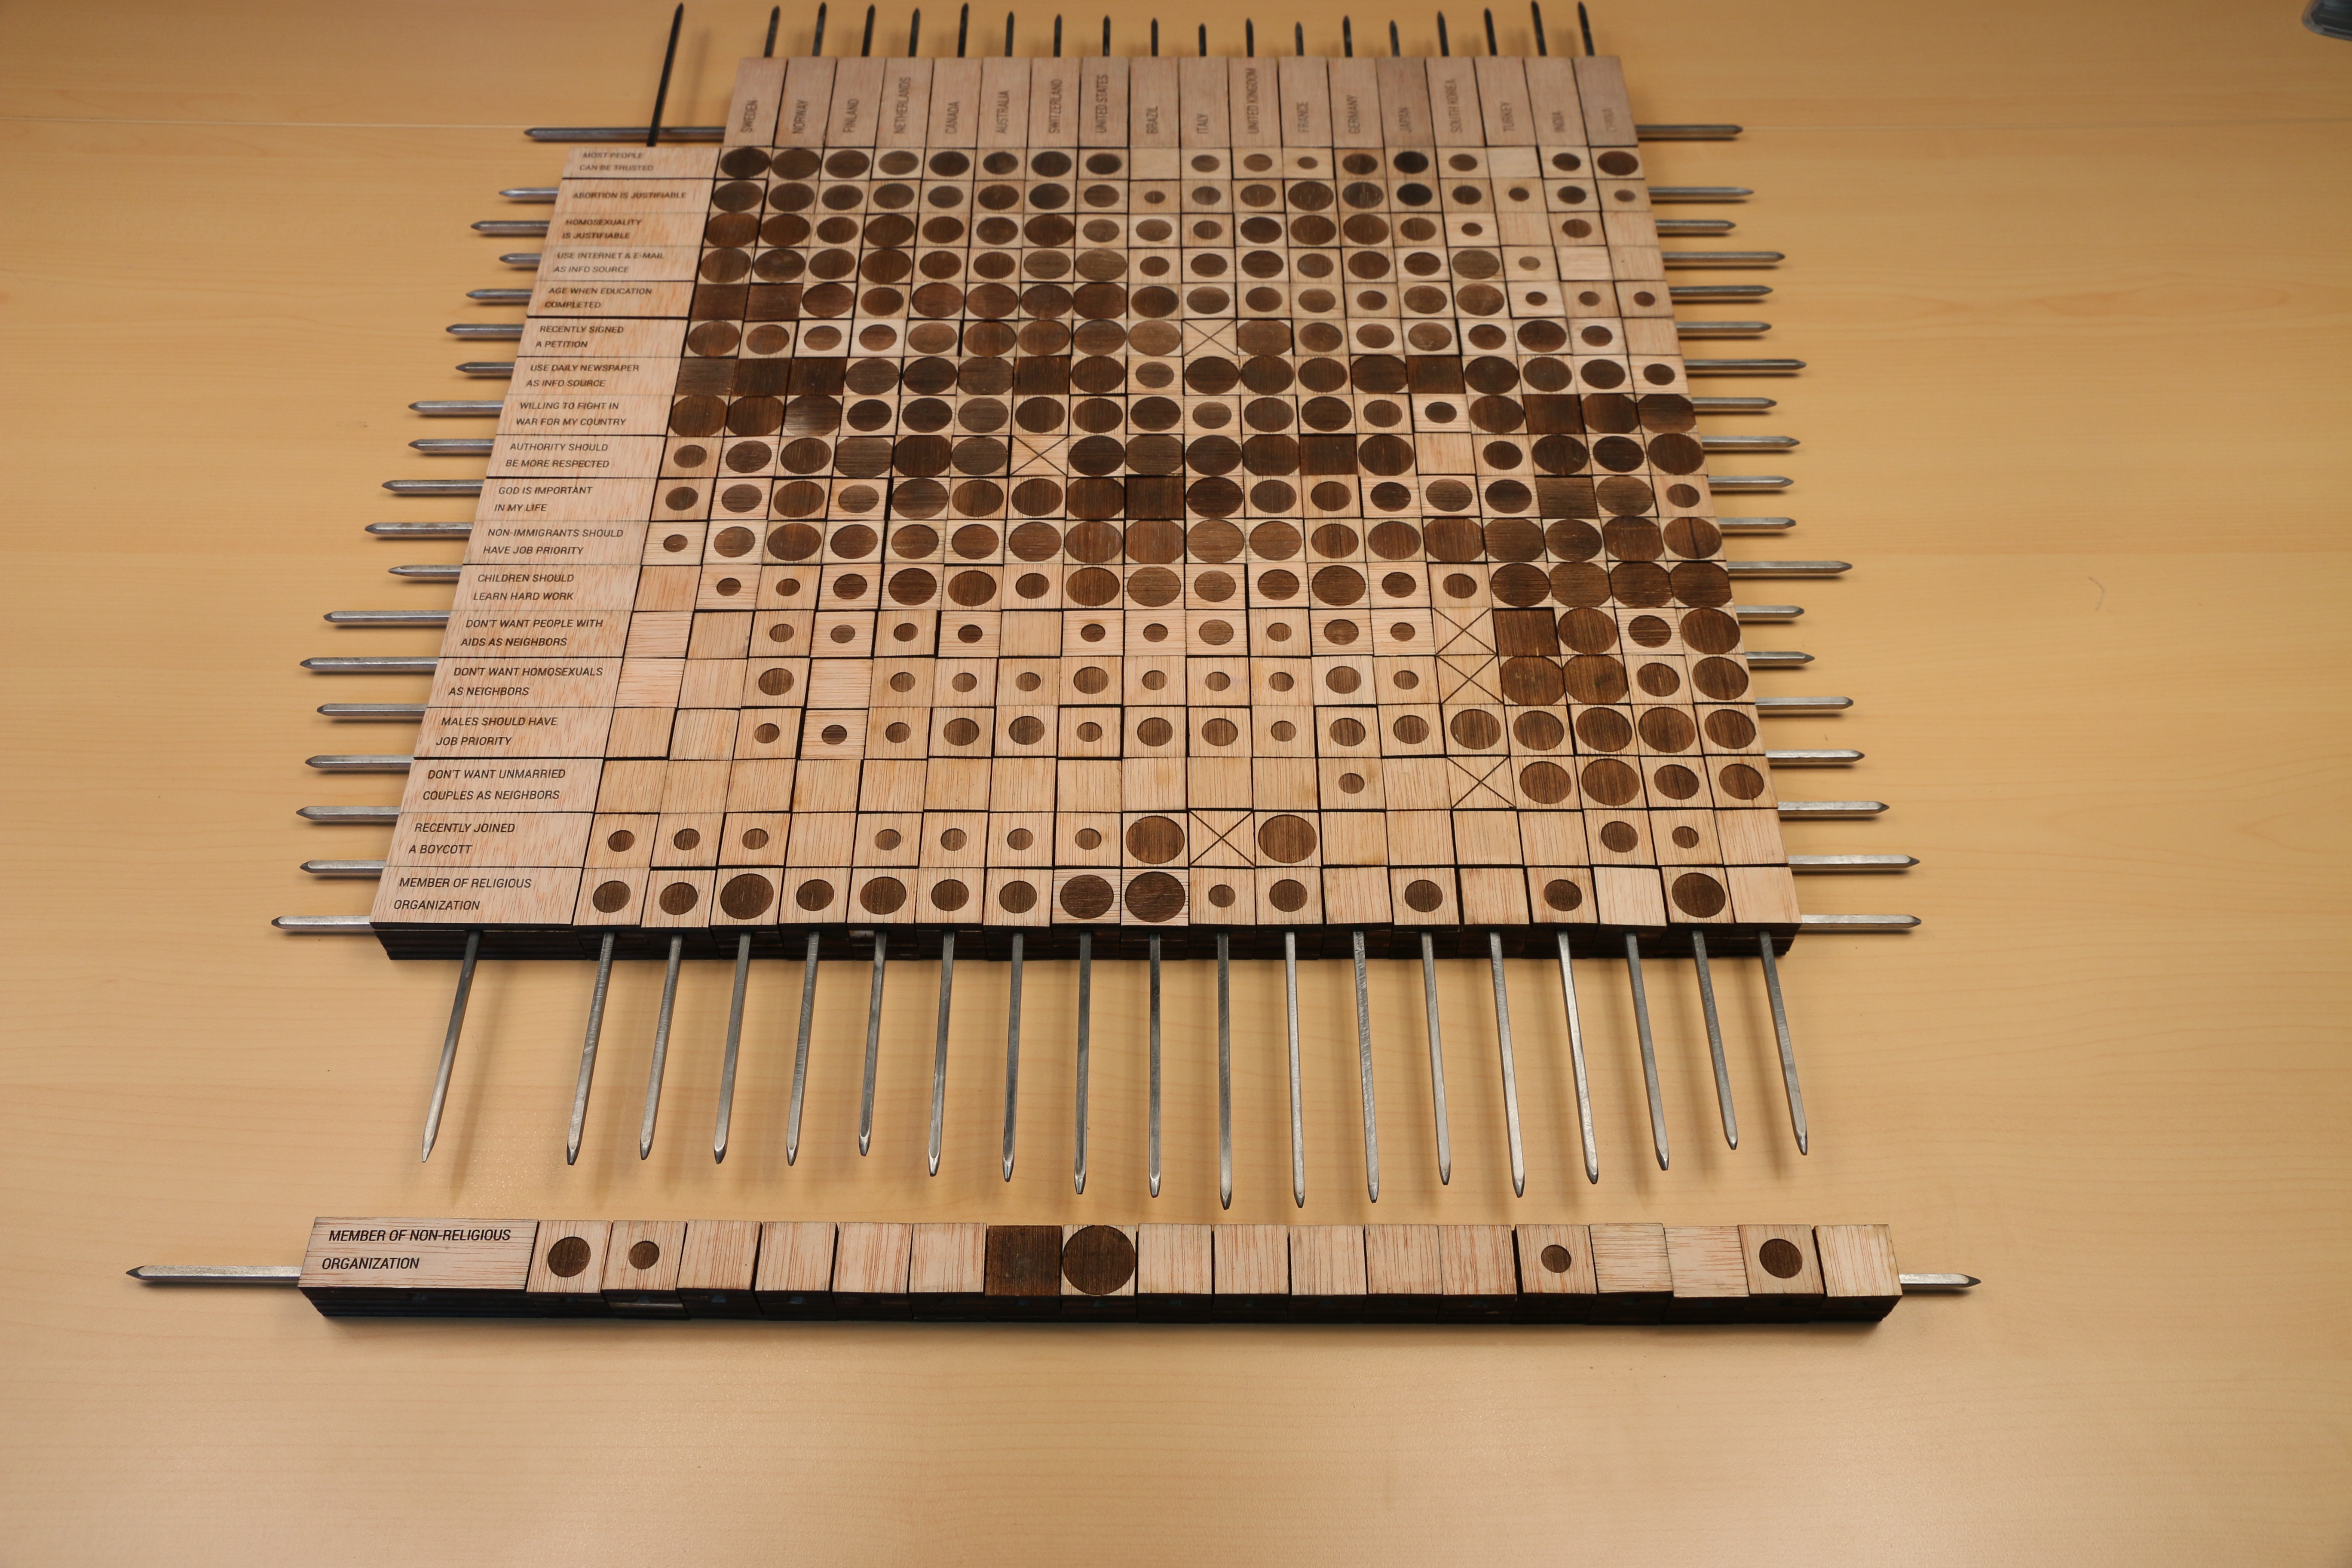
The physical Matrix, a large-scale replica of Jacques Bertin's physical matrices that he called Domino 1, 2, 3, 4 and 5.
Click on an image to access its high-resolution version.
Context
For Jacques Bertin, many data analysis questions start with a two-dimensional numerical table: one dimension as rows, the other as columns. In Semiology of Graphics [1], he gives a taxonomy of data dimensions, of which one criteria is whether a dimension is reorderable. For example, if a dimension is time, one usually wants to preserve its natural order: it is not reorderable.
When both dimensions are reorderable, the appropriate visualization is a matrix, i.e., a table where cell values are encoded visually. For Bertin, the matrix was the most general and clearly the most important visual construction.
The key idea behind the methods he used for more than 15 years [2] [3] (in the 70's--80's) is that visual representations should be rearrangeable to reveal patterns: "this point is fundamental. It is the internal mobility of the image that characterizes the modern Graphique. We do not "draw" an image once for all. We "build" it and rebuild it (we manipulate it) until all hidden relationships have been perceived." While he did not have access to computers at this time, he already figured out that interaction was at the heart of visualization.
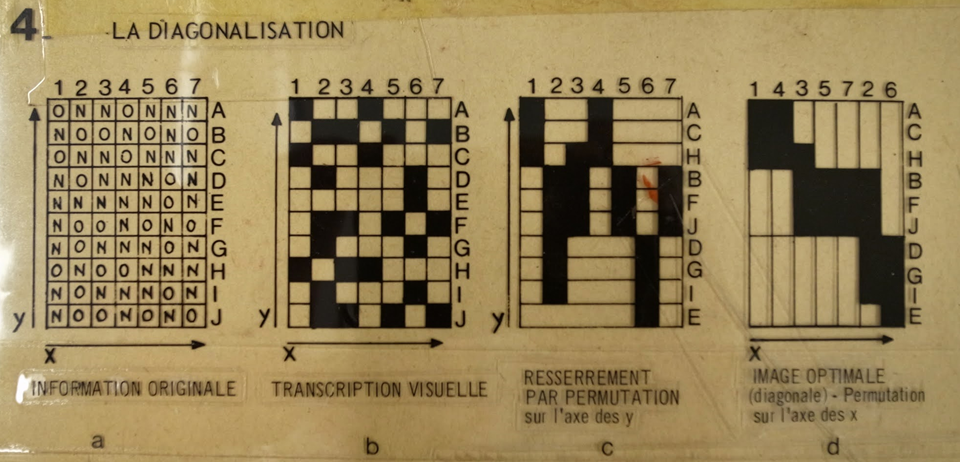
The image below shows the famous "Towns" dataset from Bertin that illustrates the method. He first built a table, here a binary one, with towns in rows and characteristics in columns (a); then, he encoded each cell according to its value, yes being black and no being white (b); then he reordered rows by visual similarity (c); and finally he reorders columns (d). At the very end, he annotated the table and analyzed the results, correlations, and groups.
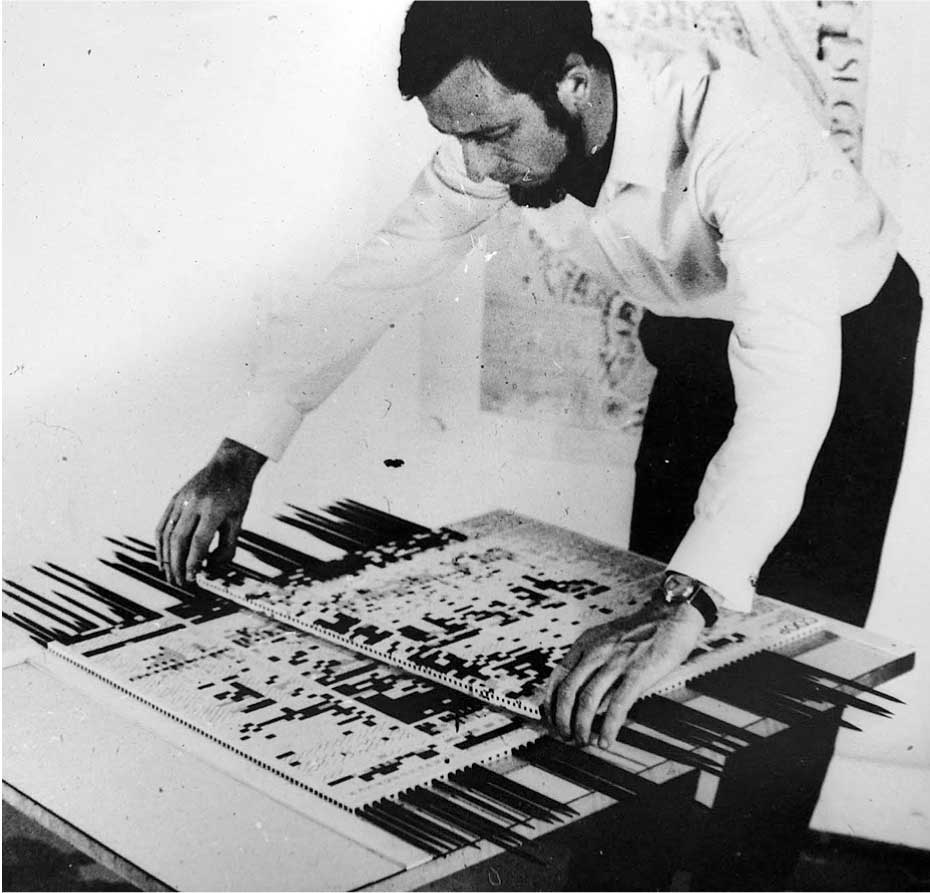
Reordering was clearly the most crucial but also the most time-consuming part of the matrix visualization process. In 1968, Bertin and his colleagues started to design a mechanical device that would facilitate reordering: the reorderable matrix.
The reorderable matrix, illustrated in the figure below, consisted in separate plastic cells, and a rod mechanism for reordering them across either rows and columns. The device underwent successive refinements up to the 80s, was sold to other French labs, and even used in schools.
Bertin nicknamed his reorderable matrices "dominos". He designed and built five versions, each with a different size and visual encoding. He also explains the general workflow involved in using them. First, an initial numerical paper table was made. Then, cell values were converted into discrete steps on another table. The physical matrix was then assembled by choosing among a collection of physical cells that encode different ranges of values. Then, the matrix was reordered. This stage is the most fundamental one and was performed visually, using what Bertin called the "Painter's eye" [4]. Finally, meaningful groups were identified and named. The result was then photographied or photocopied, and the final image was used as a figure in the scientific publication or textbook.
Bertin's physical matrices underwent several computer adaptations and progressively ceased to be used [5]. While computers can dramatically accelerate the reordering process, physical matrices provide unique affordances that can be beneficial in educational or museum settings, and that may support a deeper engagement with data [6]. One drawback with Bertin's original physical matrices is that they were only accessible in a few labs and schools in France and thus could not be widely adopted.
Based on existing variations of dominos, we designed a new version using modern fabrication tools, keeping in mind that this modern version should feature new characteristics that the original ones did not have. In particular, we wanted the matrix to be i) low-cost, while the ones Bertin built were extremely expensive; ii) accessible to many people, while the original ones had to be ordered and built by industrials; and iii) easy to manipulate, while the original ones were difficult to operate and the pieces too small. Thus we provide a design that anyone in the world who has access to digital fabrication facilities can reuse at low cost.
Description
The large wooden matrix shows a subset of the
World Value Survey [7],
a series of questionnaires that assess people's moral values across countries and years.
We selected countries with the most attendees at VIS 2014. We then computed the average country response
for each question, and selected the questions yielding the highest variations in responses.
The moral values of VIS attendees are likely not representative of the population of their country of origin.
Nevertheless, we thought this data could spark interesting discussions.
Fabrication
The wooden matrix was built by first loading the data into the Bertifier software [5] and exporting a 2D matrix visualization in SVG. From this, Mathieu Le Goc fabricated the matrix in the Fablab Digiscope.
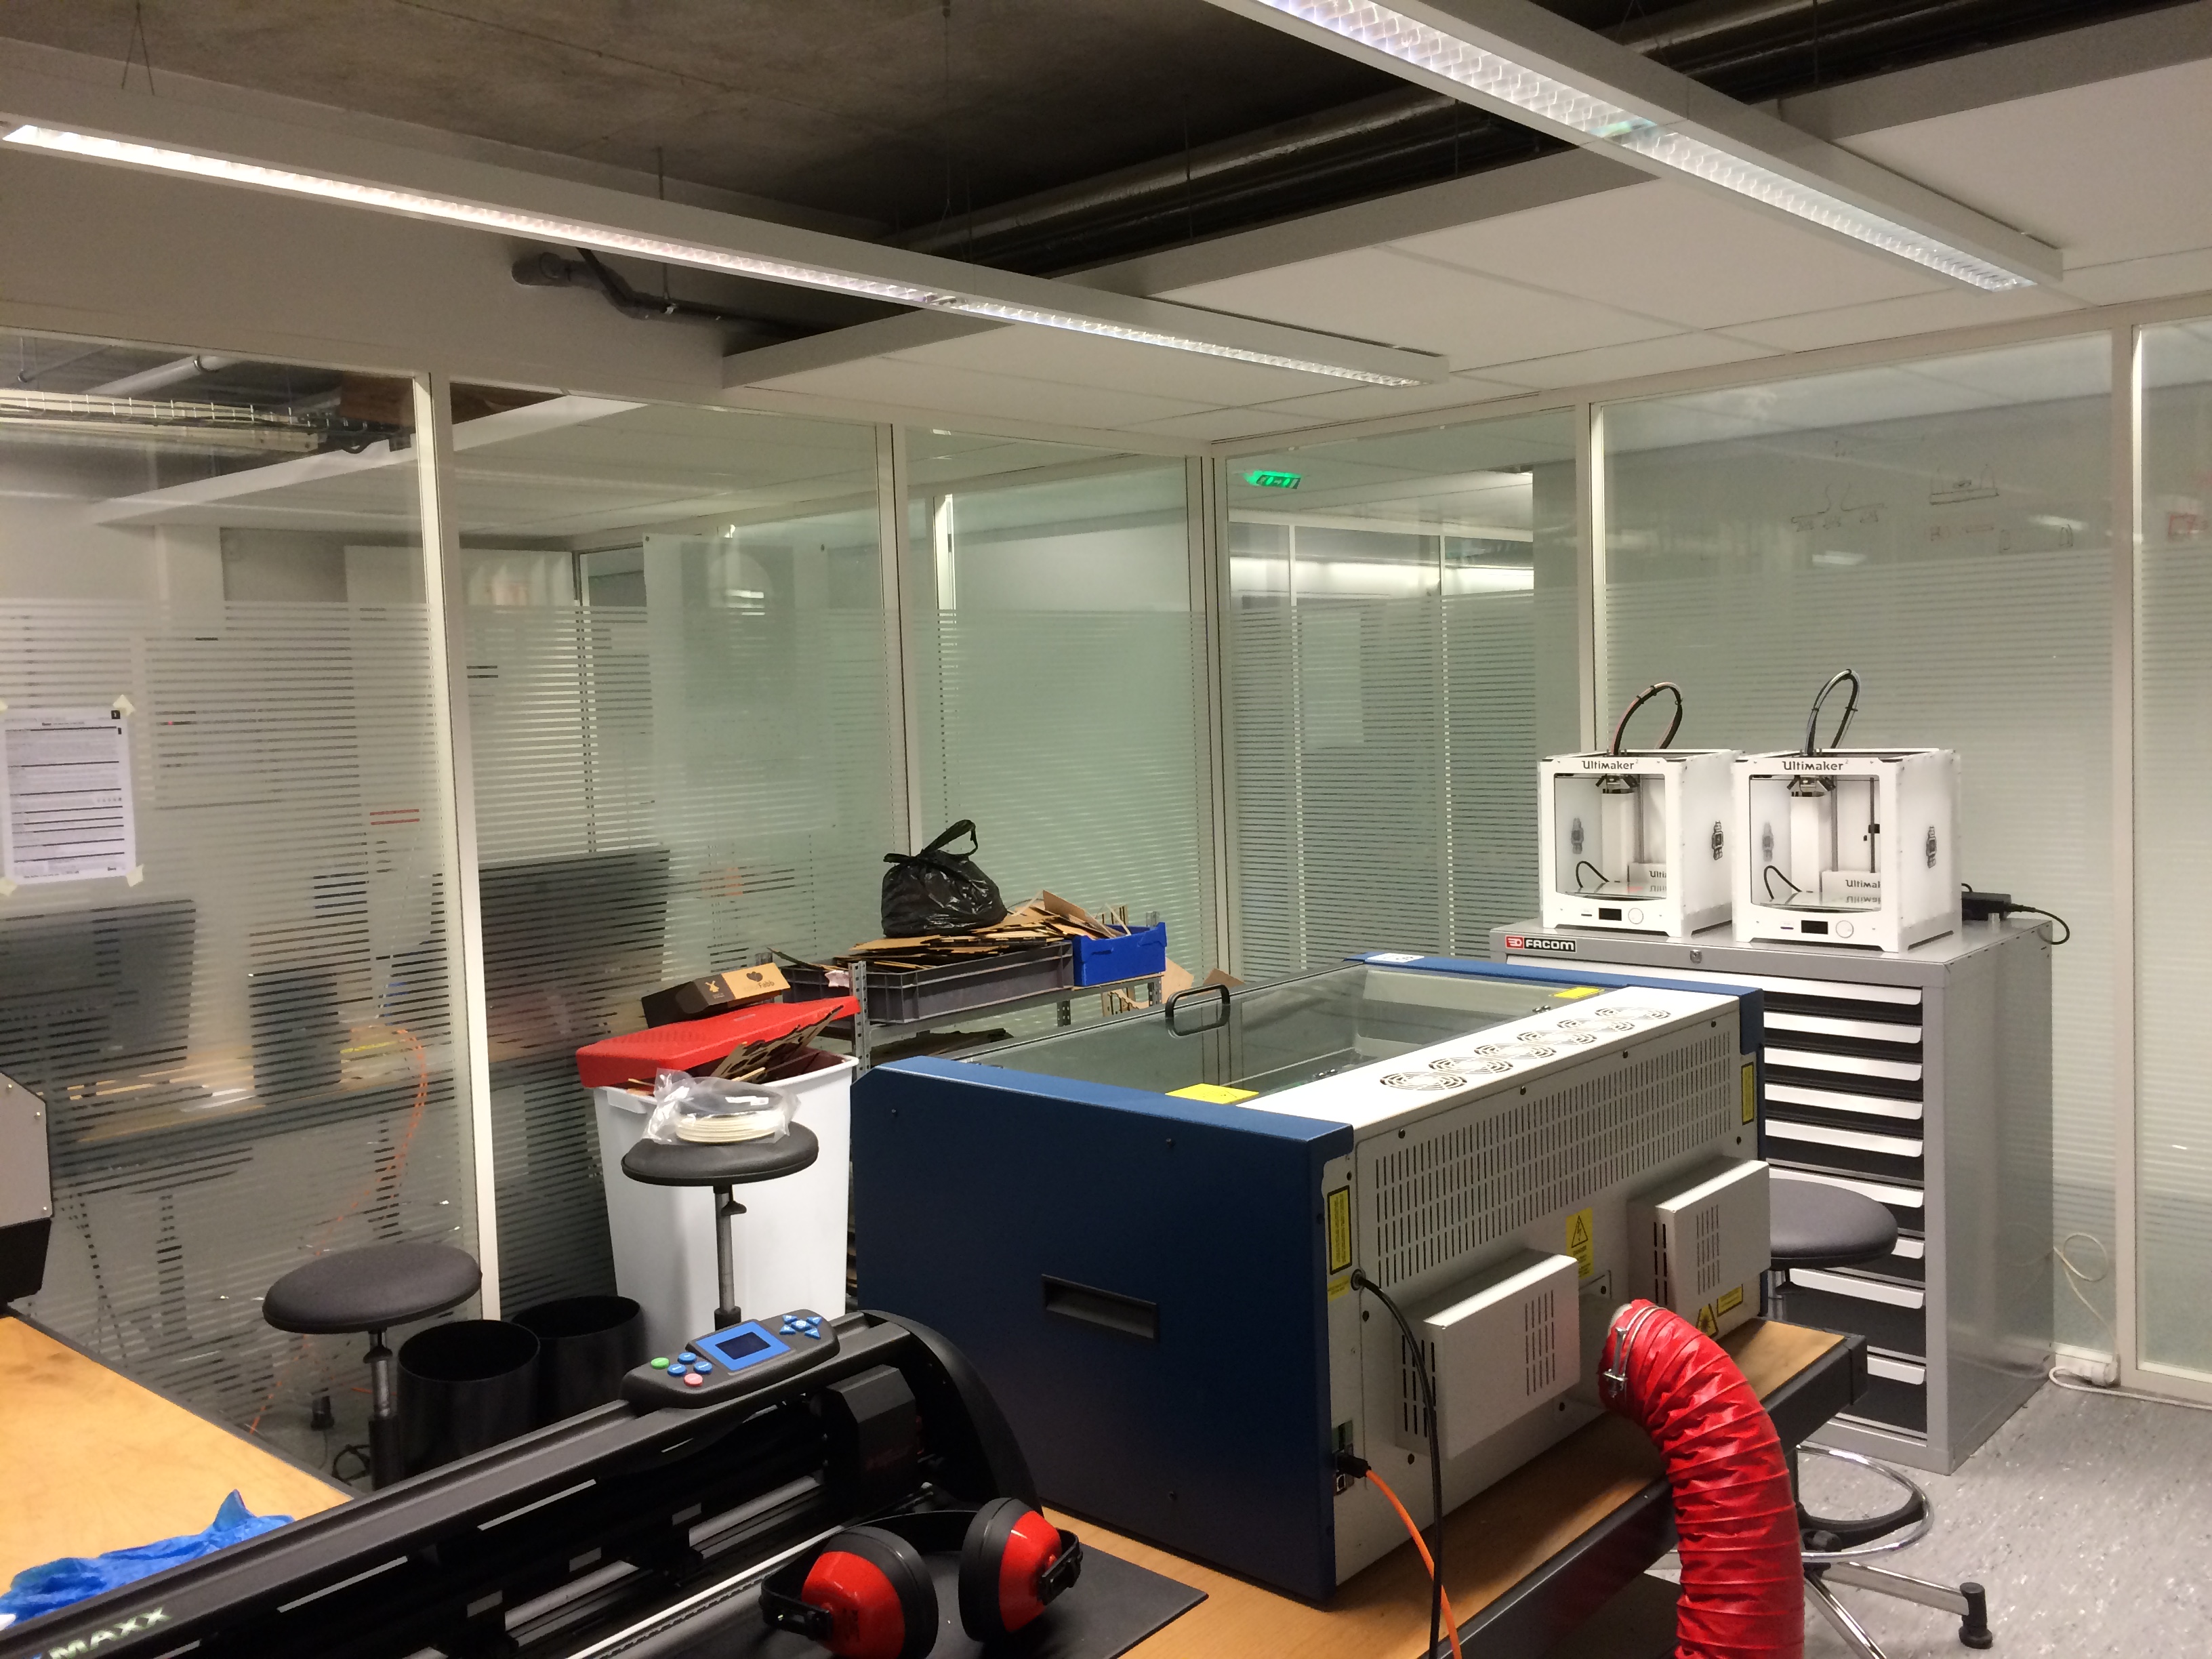
The SVG file was turned into a digital fabrication design file. Sheets of plywood were laser-cut, laser-engraved and manually assembled. Steel rods were bought in a DYI store and cut. The resulting matrix is a simplified version of the original, but also features a few innovations, such as the use of a magnet mechanism to switch encodings.
This video illustrates the fabrication process.
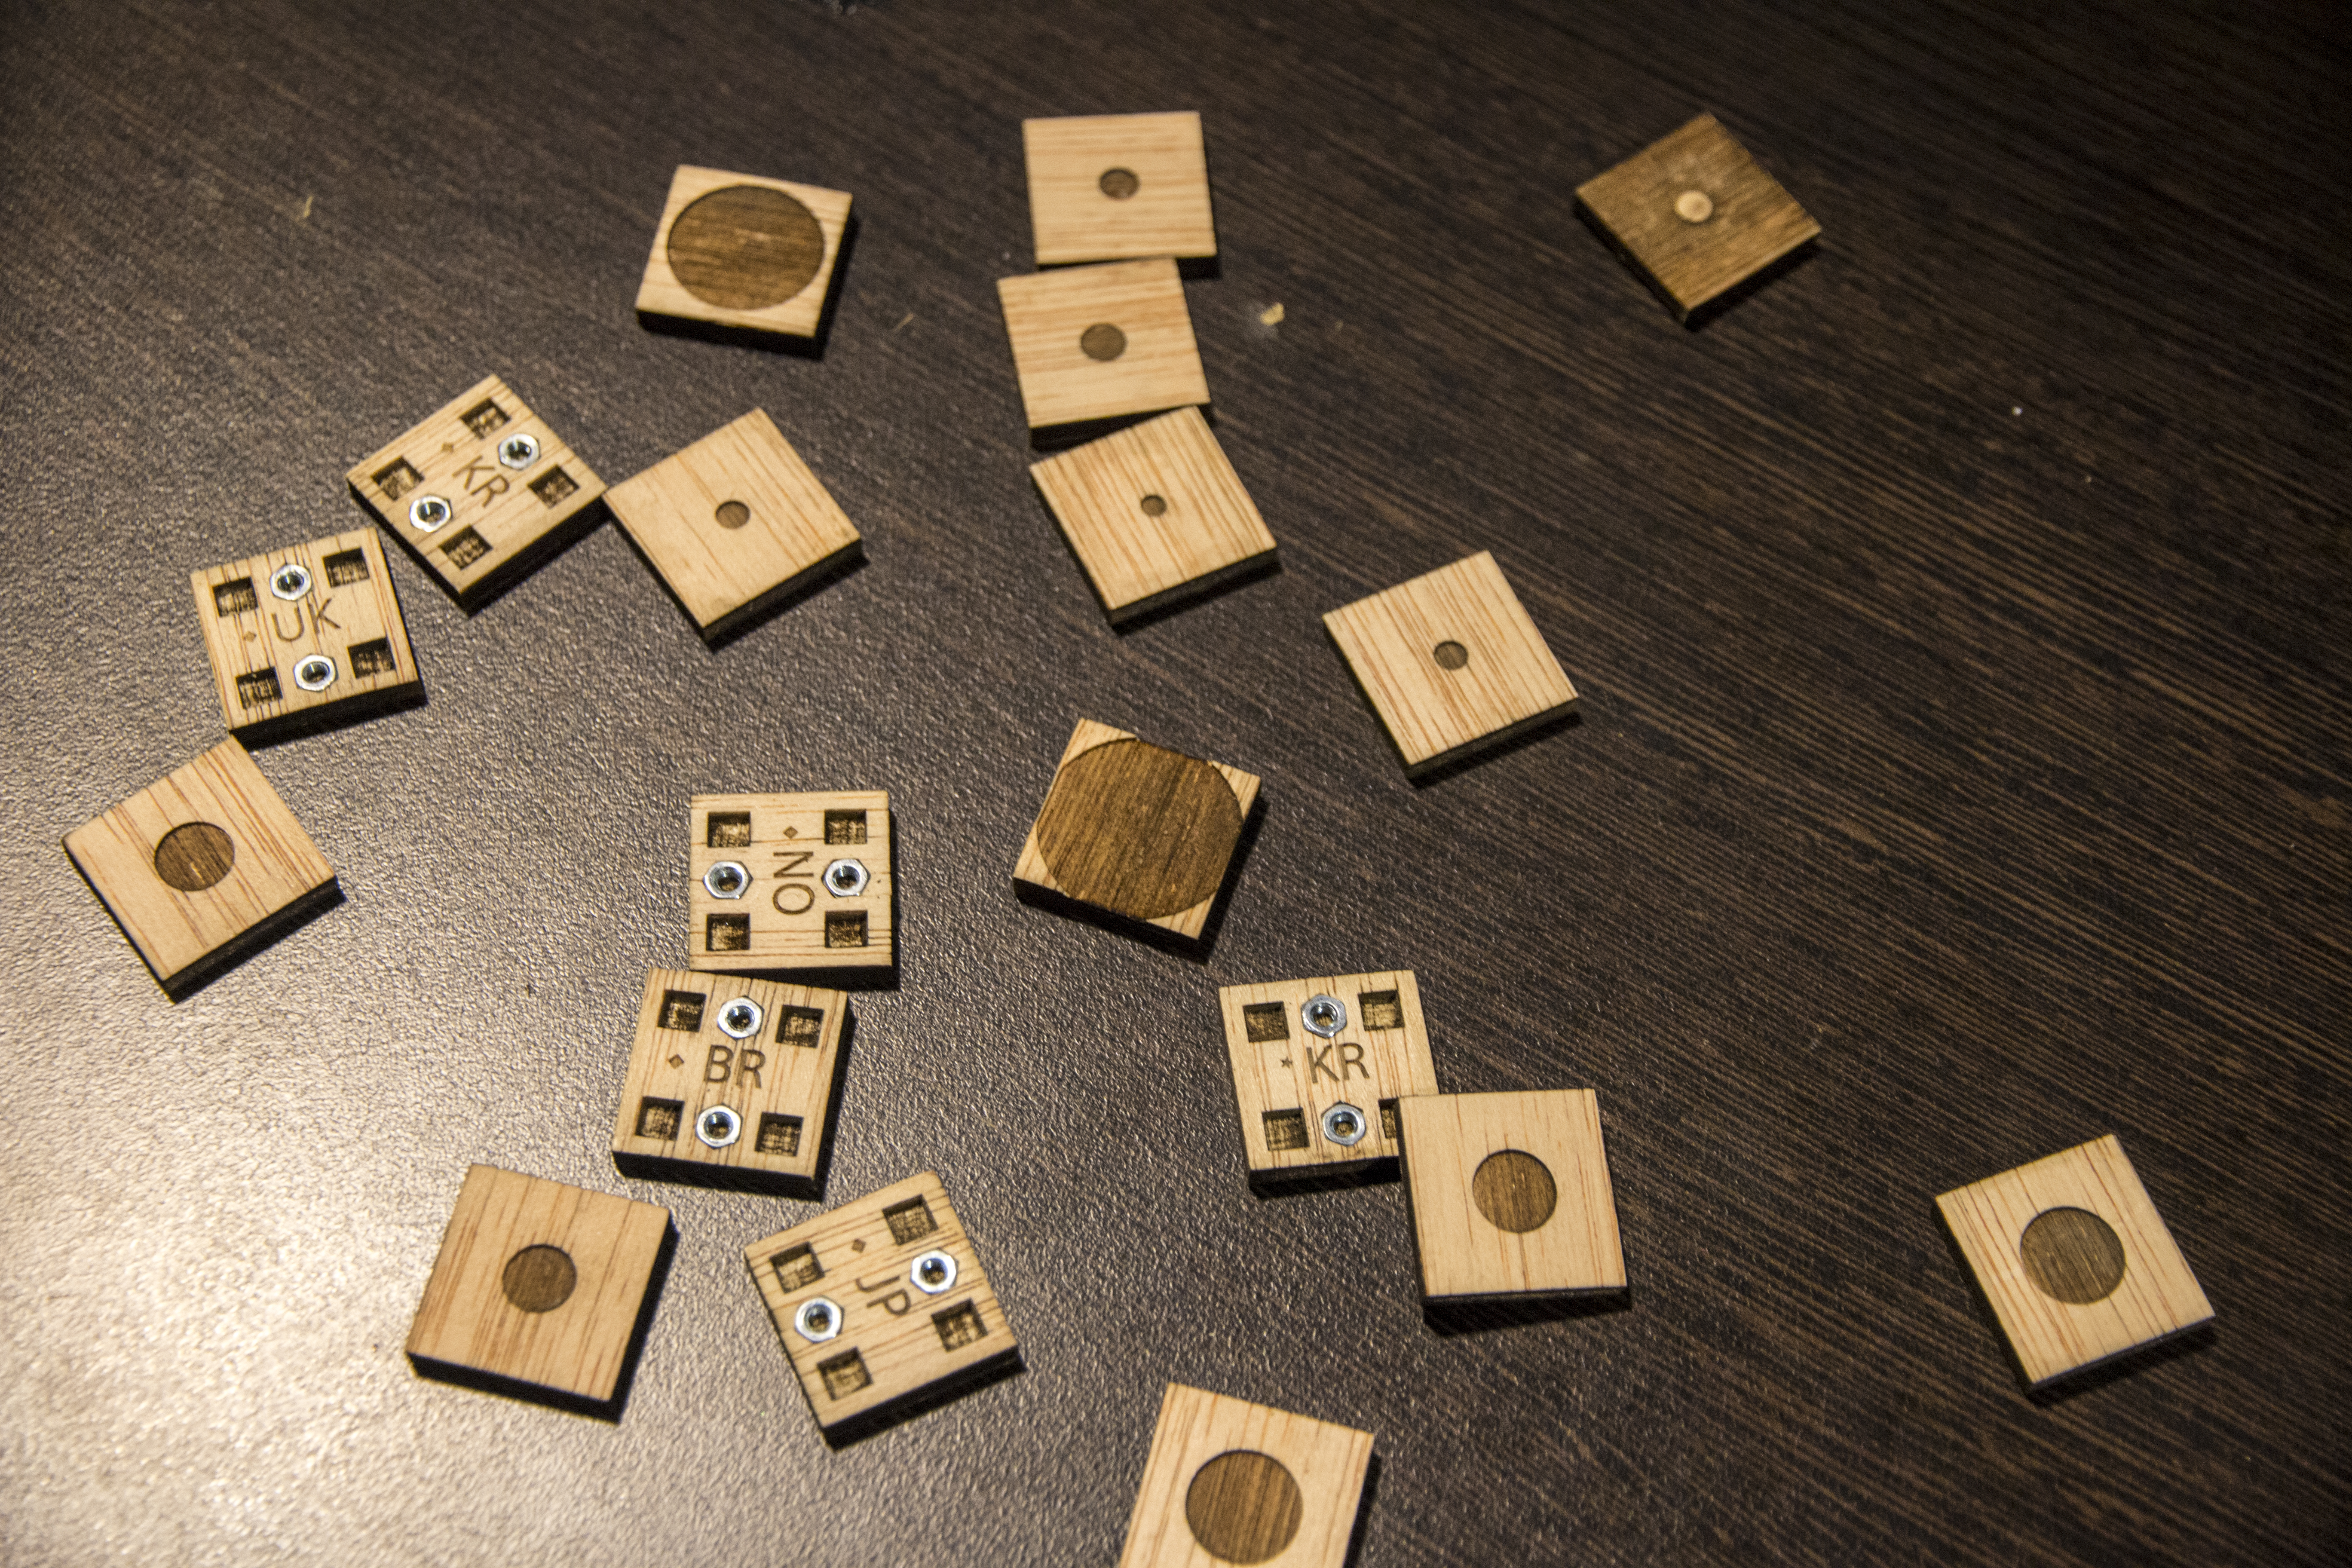
Each domino is made out of plywood and laser engraved for clear and crisp inscriptions.
Each domino is constituted of eleven parts assembled together without glue.

Encoding caps can be changed thanks to magnets.
Overall, the matrix consists of 569 dominos, requiring assembling 4414 wooden parts laser cut from 2.16m2/23.25sqft of plywood. Cutting the wooden pieces took approximately 15 hours and assembling them more than 50 hours. Its cost was approximately 20 Euros for the wood and 100 Euros for the rods. Using magnets makes the matrix become much more expensive.
We provide here the material for building, reproducing, or modifying such a matrix:
- The 3d model of the dominos
- The .ai file containing the cut scheme to create plywood dominos
- The .pdf file containing the cut scheme to create plywood dominos
Manipulation
Each row or column is mobile and can slide on the steel rods.
This video shows how to manipulate the matrix.
Collaboration
This matrix was exposed for the Bertin exhibit during the IEEE VIS 2014 conference in Paris.
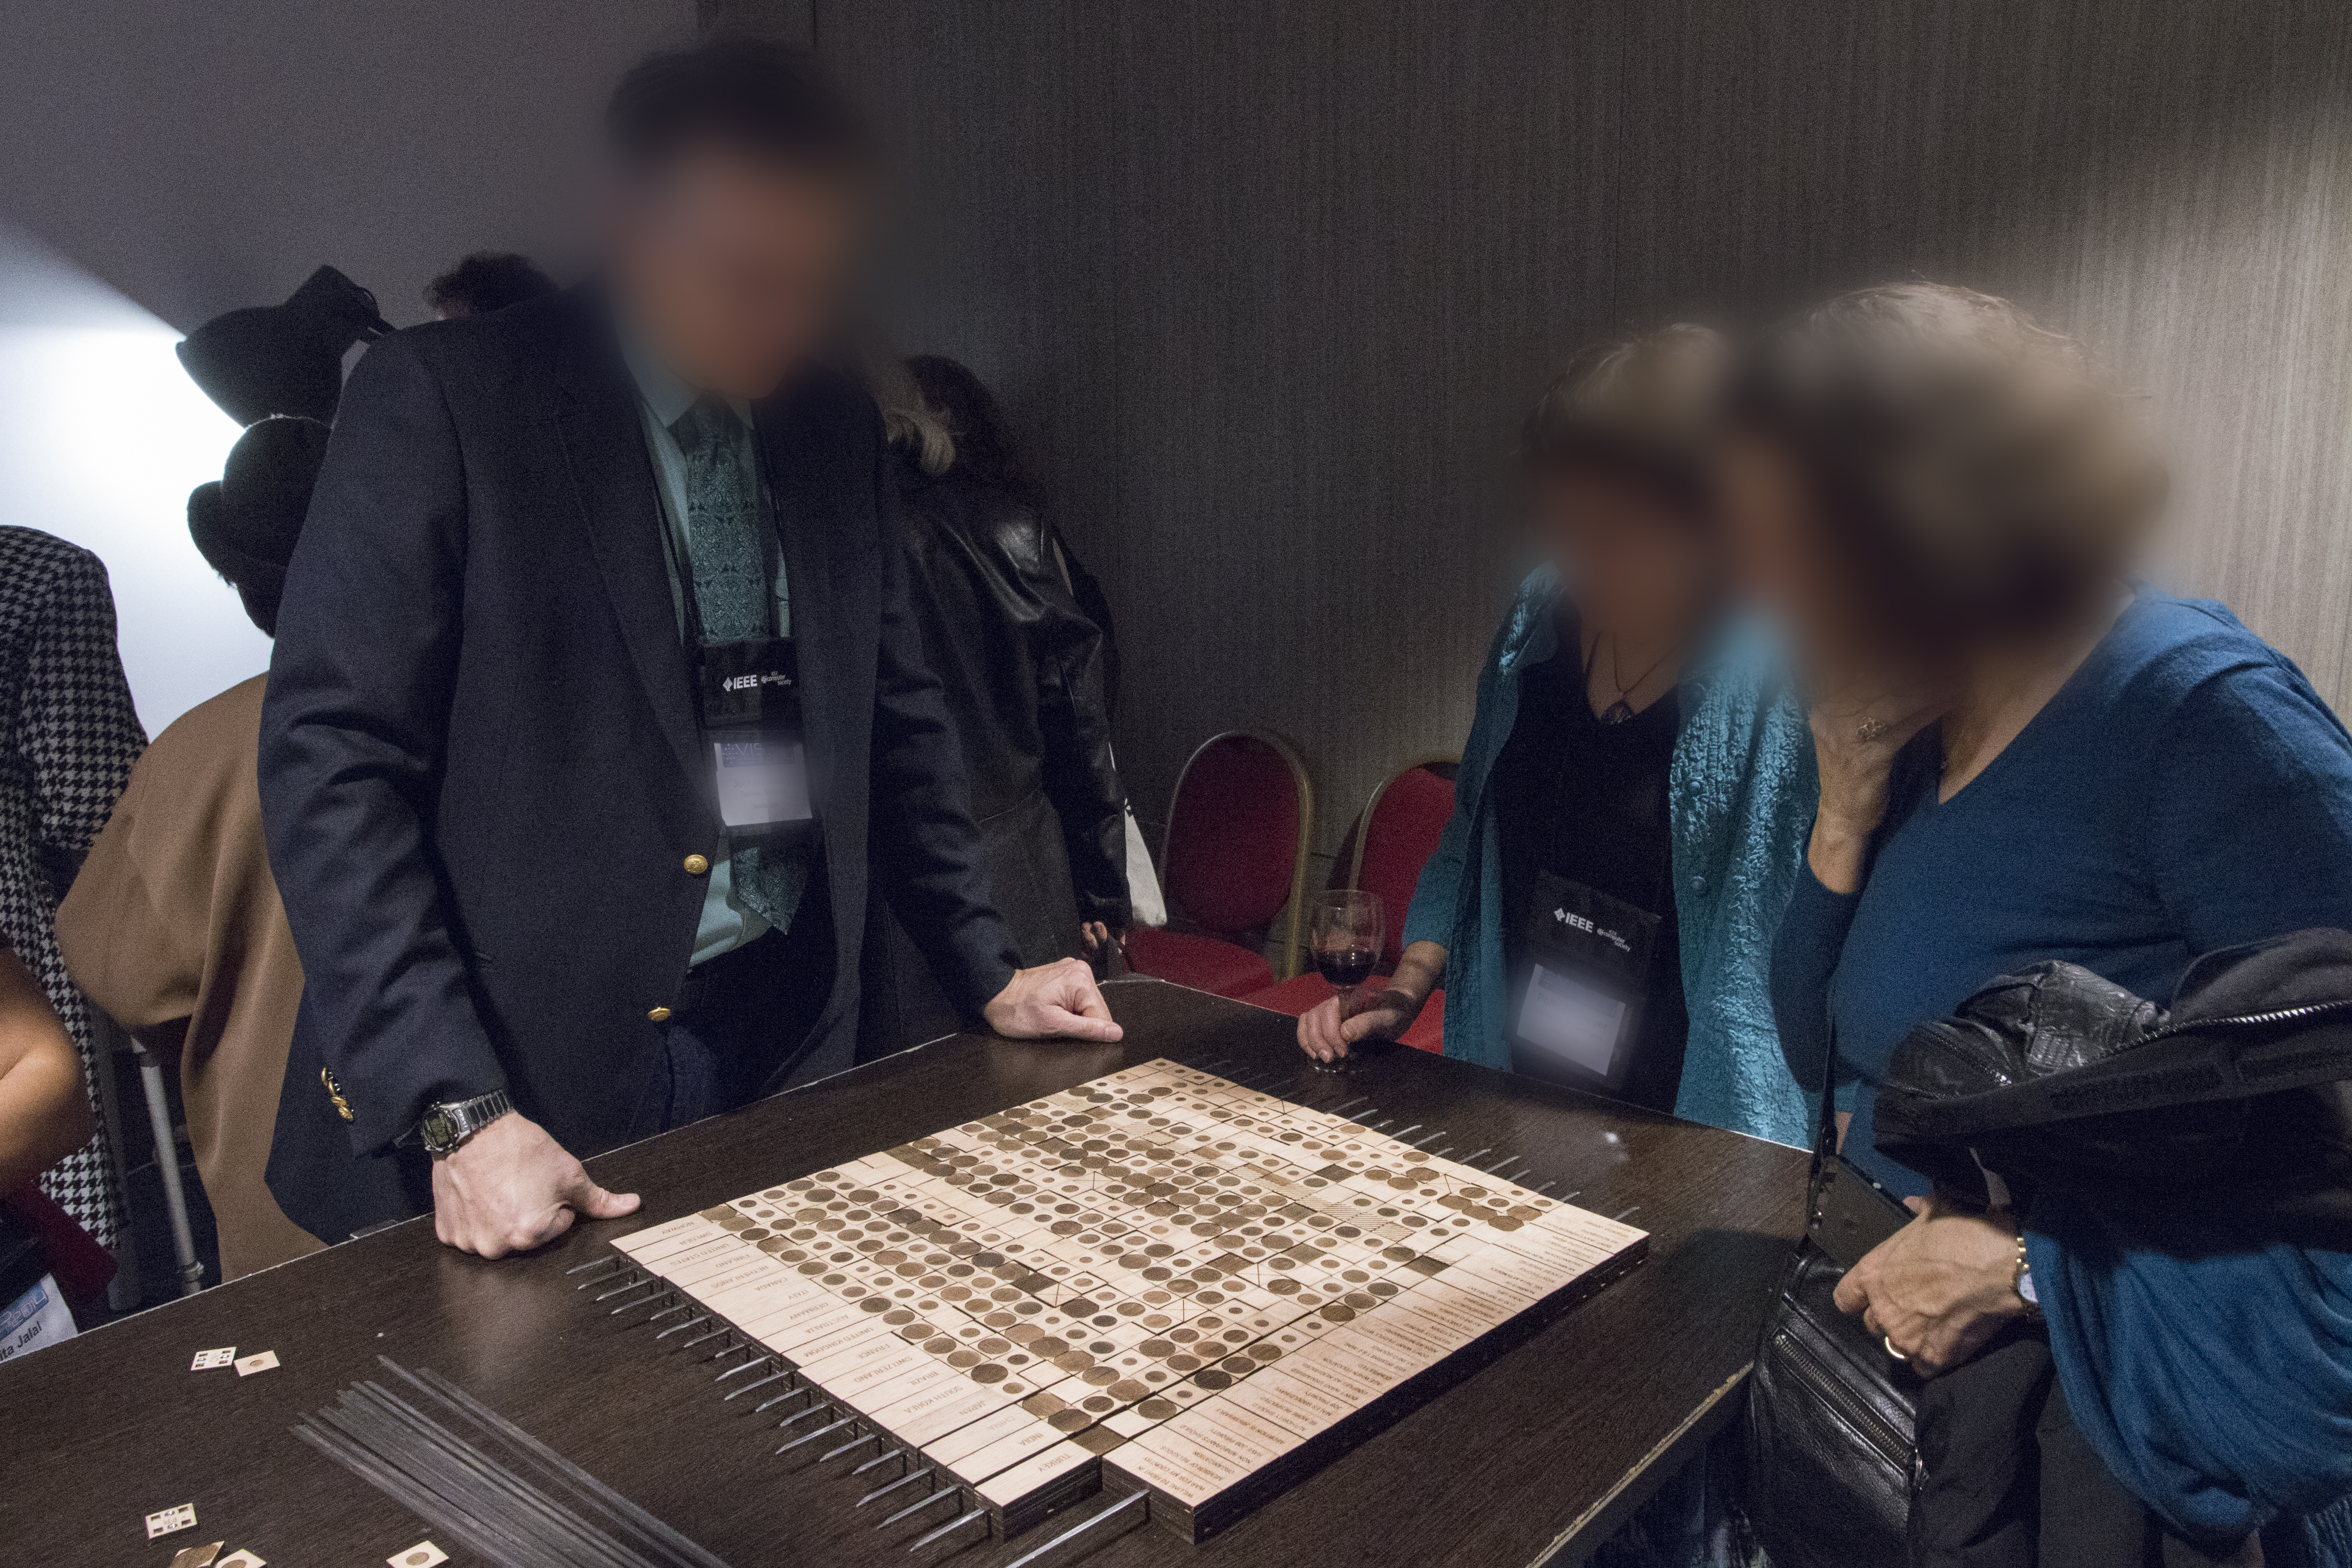
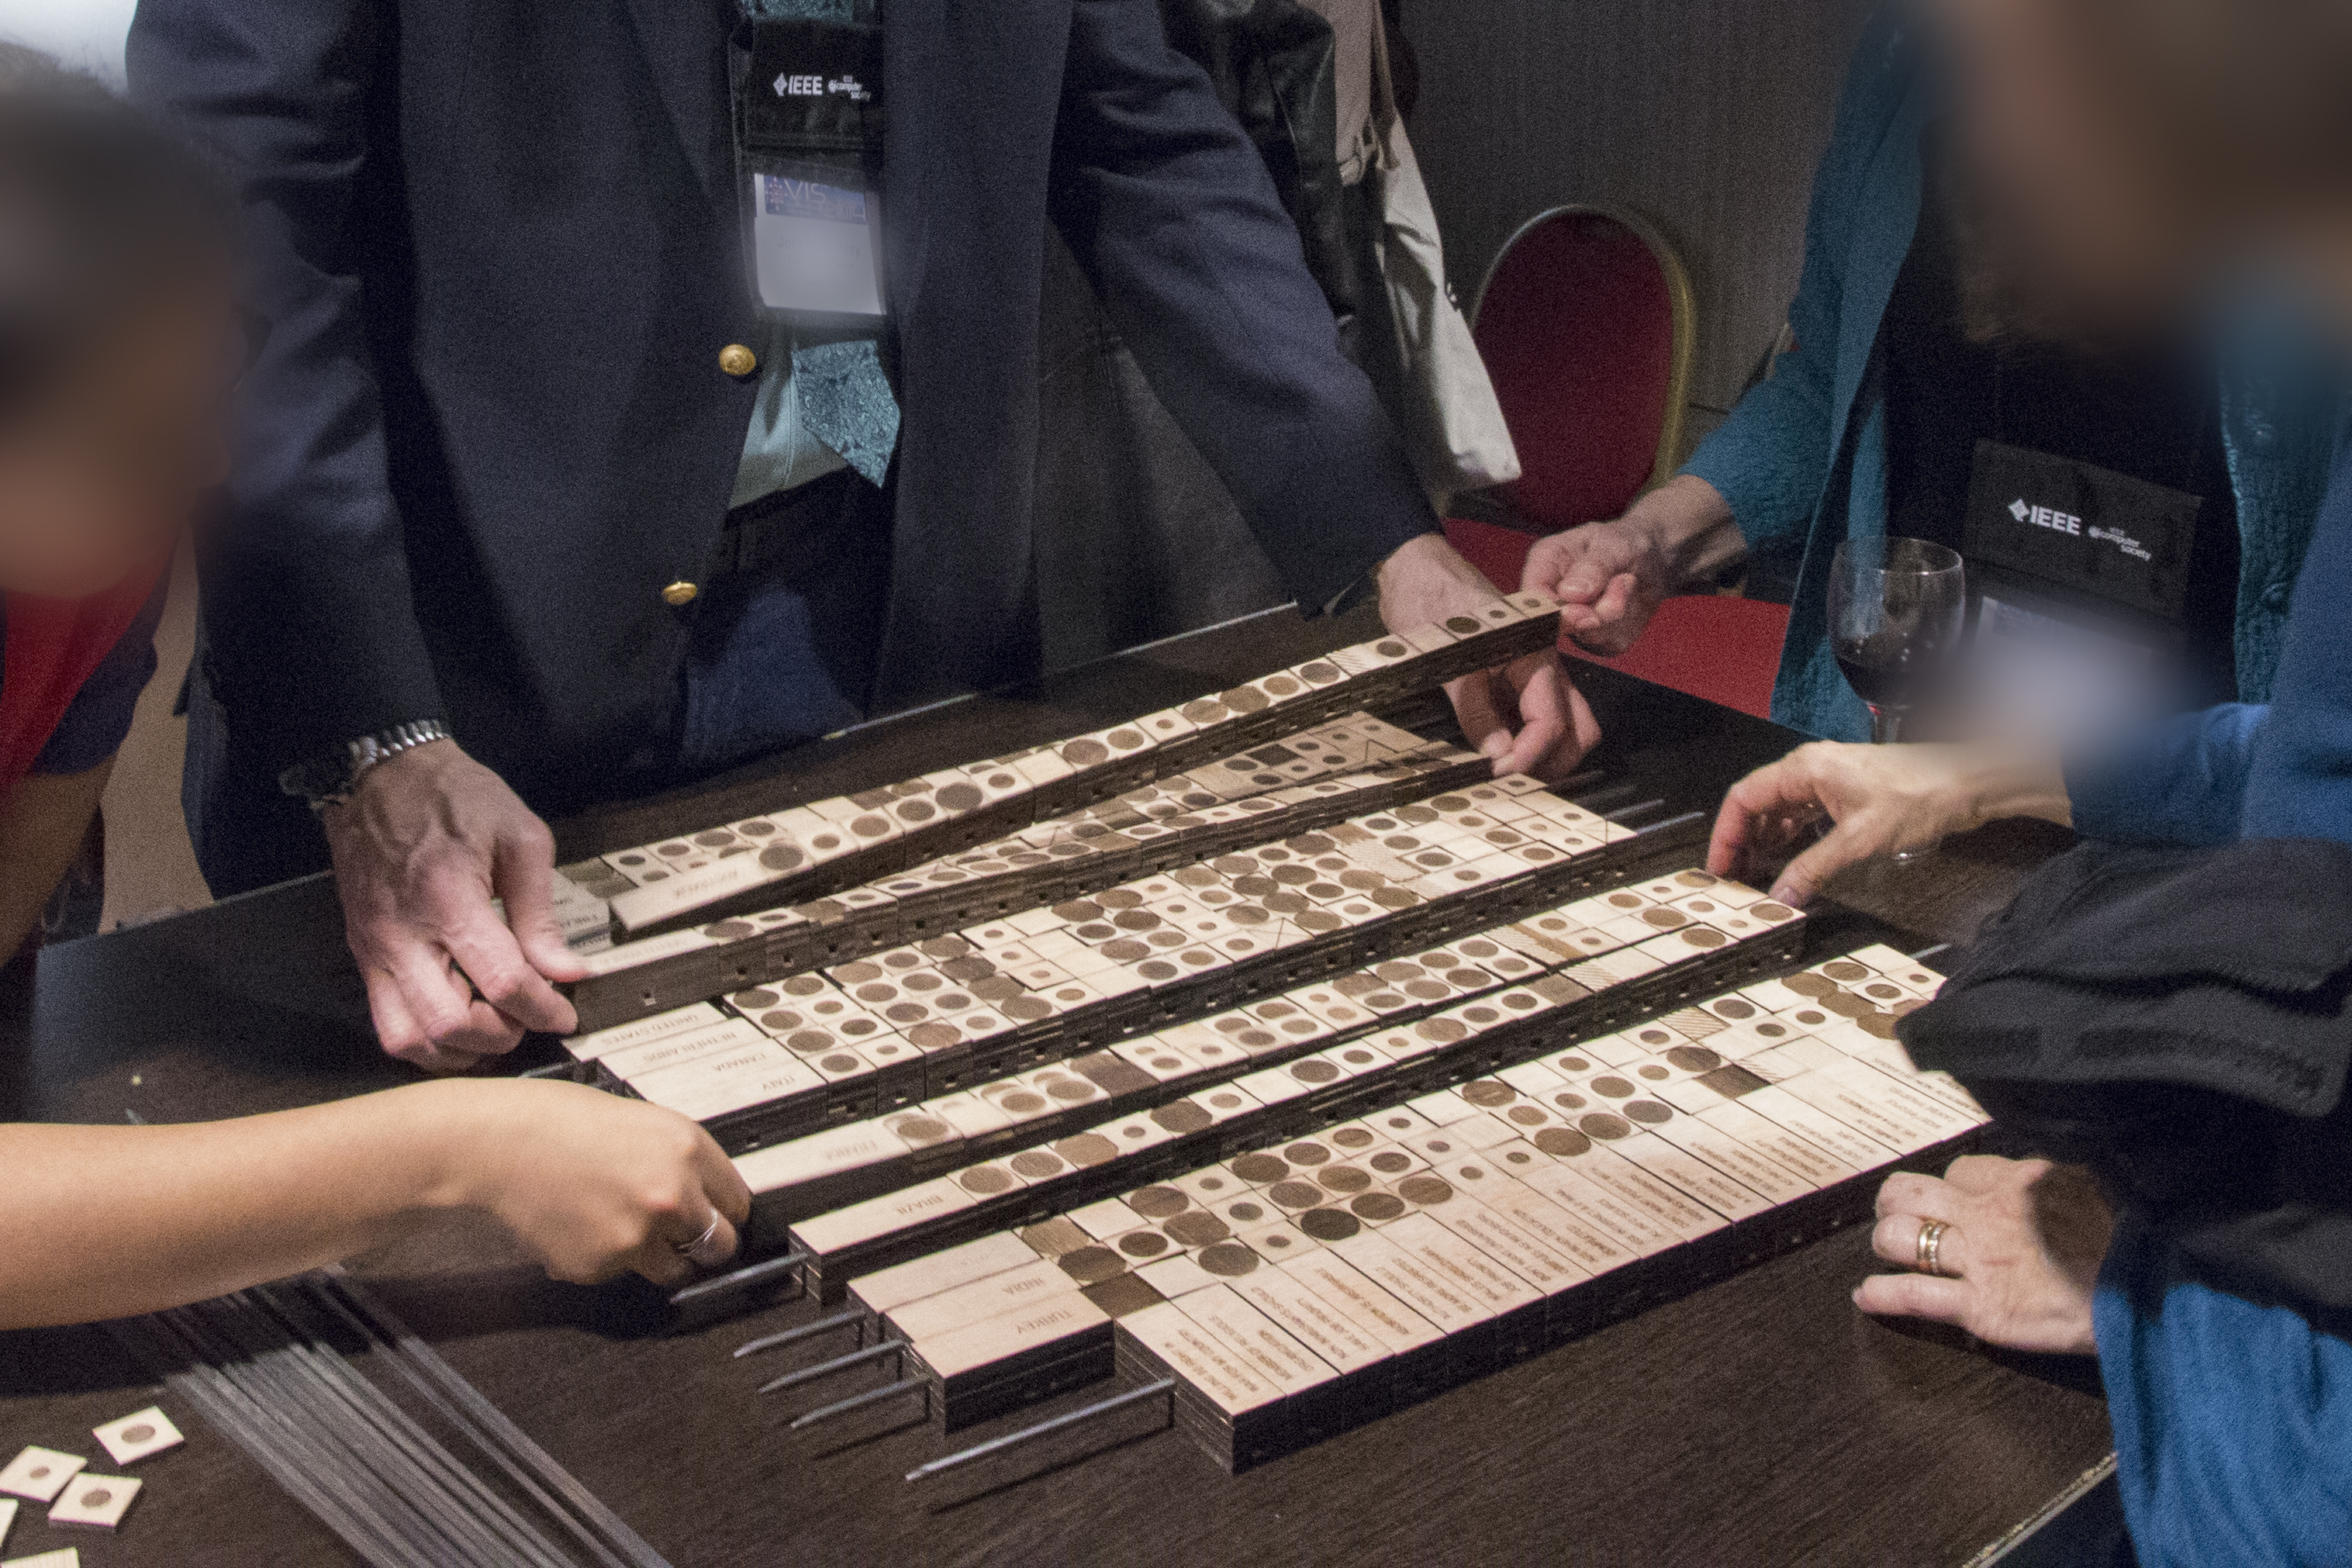
This video illustrates how such a physical device promotes engagement and collaboration.