Spirograph Designs for Ambient Display of Tweets
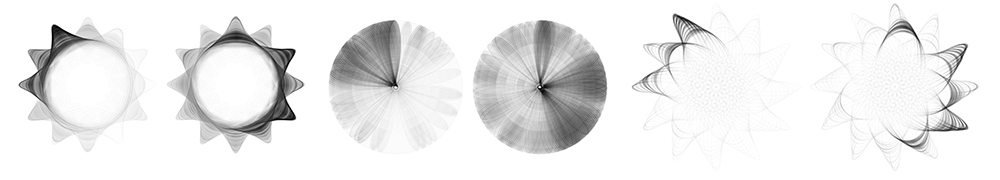
Three pairs of Spirographs, each showing morning and afternoon Tweets with hashtag #CHI2013 on April 29th, the first day of the CHI 2013 conference. They illustrate interesting design variations of Spirographs and their use for relatively large time-oriented datasets.
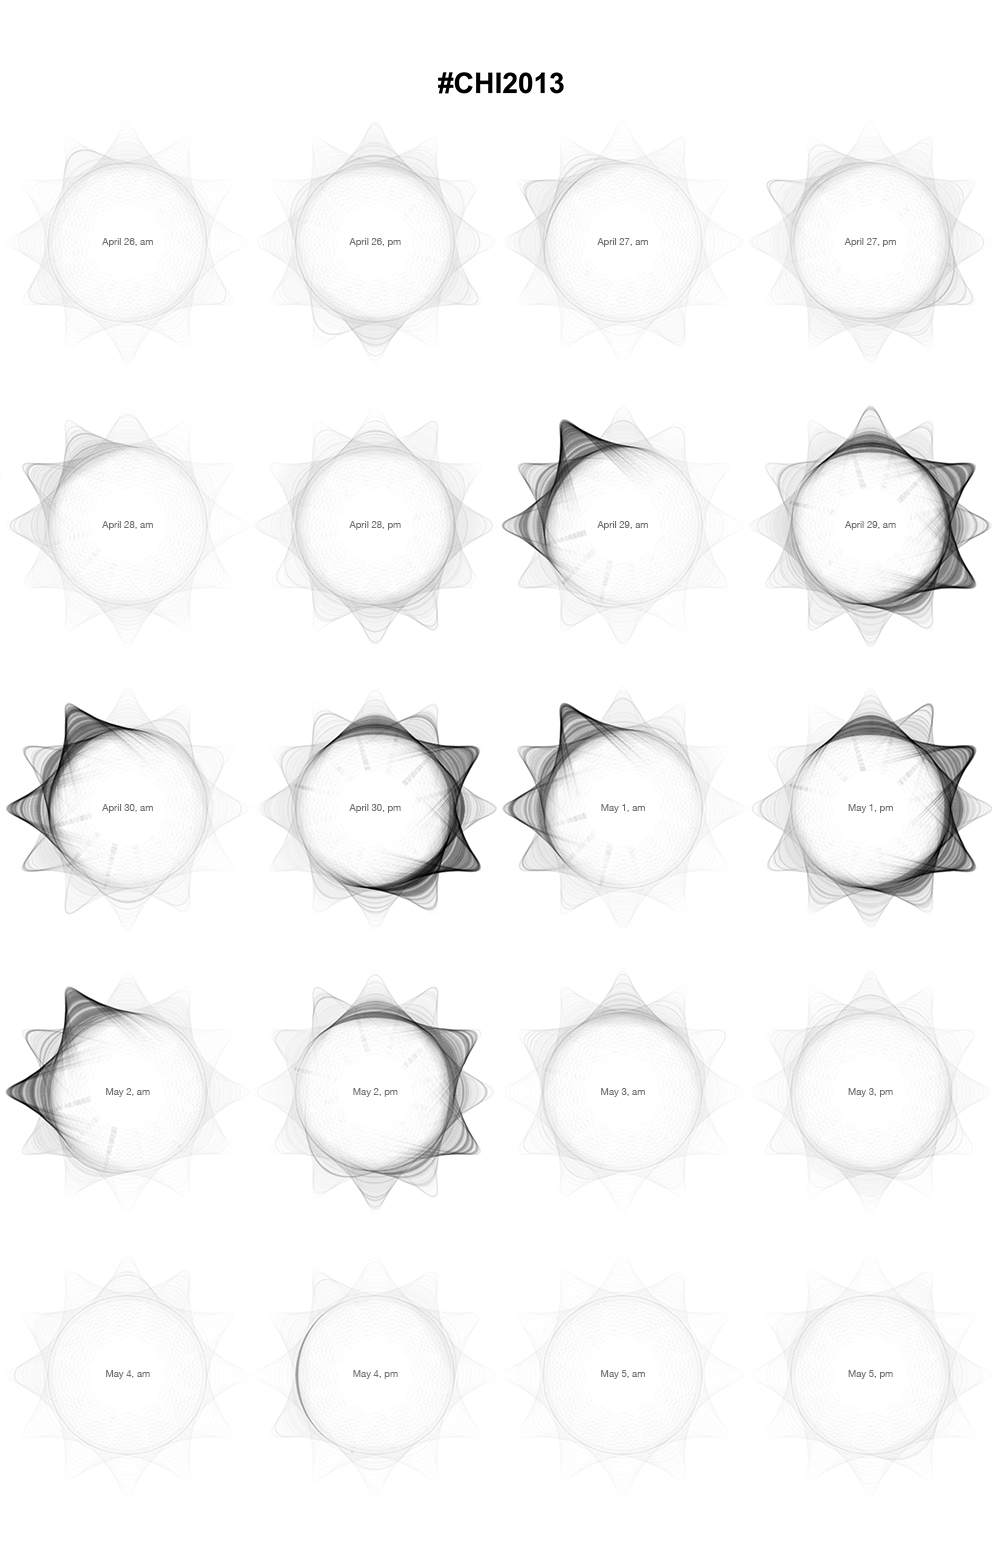
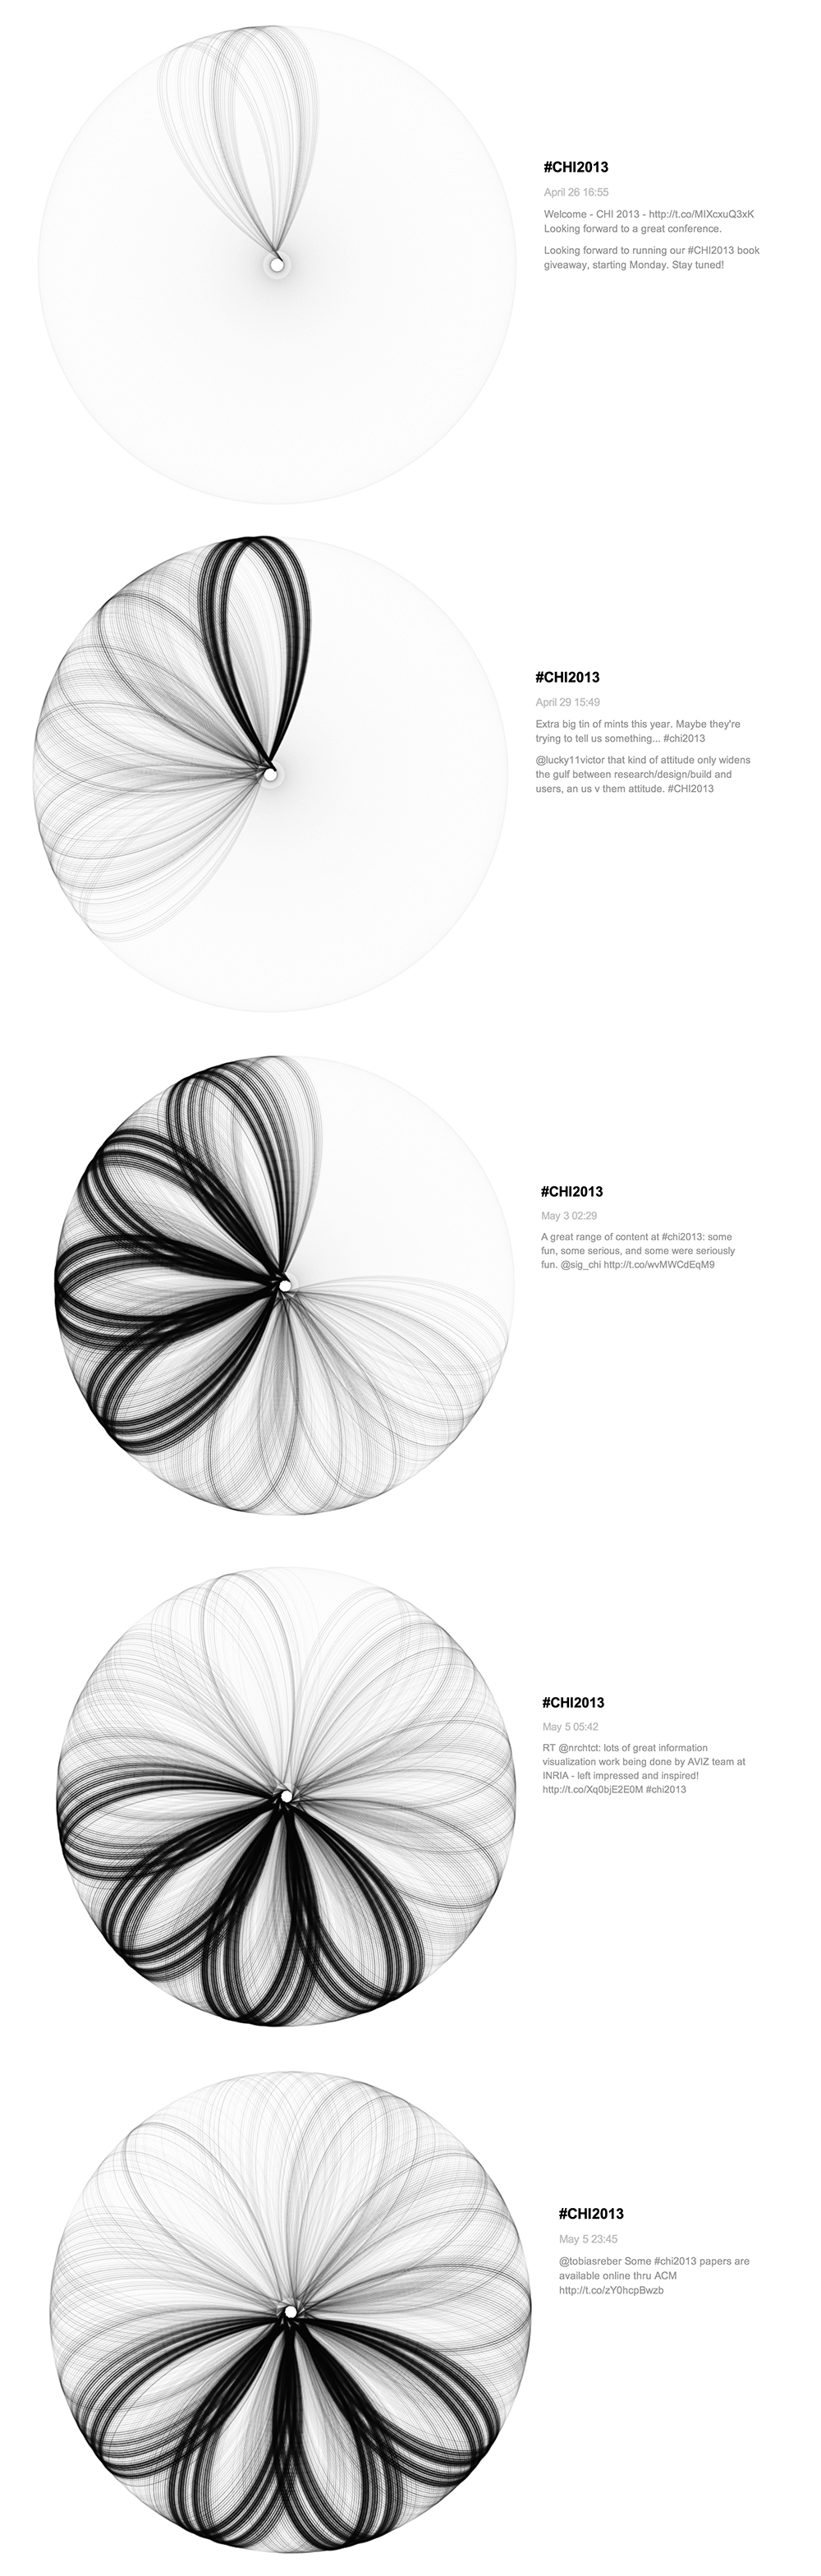
This work explores elegant design variations for Spirographs to display Tweets. Our method consisted in first tweaking Spirographs parameters using a drawing tool we developed specifically. We then identified particularly interesting Spirographs patterns and gave them flower names to better recall and describe them: sunflower, daisy or chrysanthemum, to name a few. We further customized those patterns, and eventually combined them with other Spirographs to construct more complex ones. As those Spirographs patterns were well suited to segment time into hours or minutes with their “petals”, we investigated one particular scenario: Tweets visualization collected during CHI 2013, where each Tweet is represented as a particle that decorates the Spirographs. The resulting visualization is appealing and efficiently shows Tweets distribution over time and trends both during short and long time spans. Those early results show that Spirographs can go beyond simple artworks and can effectively bear both attractiveness and structure, which make them perfect candidate for ambient display.
Videos
Publication
Ye Lin, Romain Vuillemot. Spirograph Designs for Ambient Display of Tweets. IEEE VIS 2013 Arts Program proceedings. IEEE VIS 2013, Oct 2013, Atlanta, GA, United States. IEEE
Online Demo
coming soon..
Examples
 |
 |
 |
 |
Contacts
- Ye Lin - INRIA
- Romain Vuillemot - INRIA