GraphDice
Description
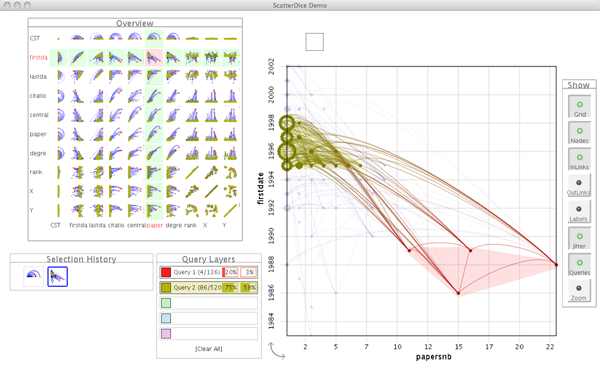
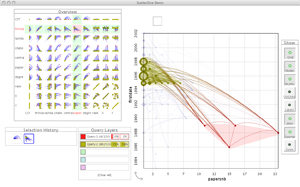
Social networks collected by historians or sociologists typically have a large number of attributes associated with their actors, and applying analysis algorithms to these networks will produce additional attributes such as degree, centrality, and clustering coefficients. Understanding the effects of this plethora of graph attributes is one of the main challenges in multivariate social networks.
We present GraphDice, a multivariate network visualization system that uses the ScatterDice technique to support navigation in all possible graph attribute combinations.
Article
A. Bezerianos, F. Chevalier, P. Dragicevic, N. Elmqvist and J.D. Fekete GraphDice: A System for Exploring Multivariate Social Networks In Proceedings of Eurographics/IEEE-VGTC Symposium on Visualization (Eurovis 2010), June 2010, Bordeaux, France. DOI: 10.1109/TVCG.2013.254 
The paper has been presented at Eurovis2010, 9-11 June, 2010, Bordeaux, France.
Video
Download the high quality video (avi, 46 MB).
Short videos
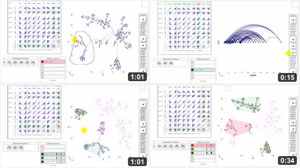 | 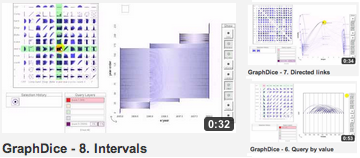 |
| GraphDice functionalities | Example Scenarios |
Demo
- Download and unzip the demo archive
- To launch the demo, run the
graphdice-0.0.1-SNAPSHOT.jarexecutable jar file.
Note: Two datasets are included in the archive (both under the data folder):
infovis.graphmlthe IEEE Infovis conference co-authorship network from 1988 to 2002raweb.graphmlthe Inria Saclay co-authorship network from 2005 to 2008
Contact
- Anastasia Bezerianos - École Centrale de Paris
- Fanny Chevalier - INRIA
- Pierre Dragicevic - INRIA
- Niklas Elmqvist - Purdue University
- Jean-Daniel Fekete - INRIA